One of the most precious pieces of information you can have to run your business effectively is to understand the revenue being generated as a direct result of some business activity.
Knowing which efforts are paying off allows you to double down and scale them up, while understanding where time and money are being wasted allows you to get more done by doing less.
This is the problem of attribution.
Marketers deal with this issue head-on because they must spend limited resources on multiple channels of influence, and prospects have many touch-points with the business during their customer journey. They must constantly ask the question:
Which campaign/channel is really bringing in the money?
This is not just a marketing problem. Every interaction between your business and the customer contributes to the buying experience, and therefore, owns a piece of the attribution puzzle.
Attribution is not purely a theoretical exercise. It has a direct link to how efficiently you spend your resources to achieve business growth. Organizations that use sophisticated attribution models to map their spend to revenue are twice as likely to have revenue growth of 20% or more.
This post will explore how multi-touch attribution has traditionally been handled and how you can improve your attribution models with a touch of data wizardry.
Throughout the post, I will use the word “touch-point” because this is a very general model, but feel free to translate this directly into your own domain. It applies equally well to a specific campaign, marketing channel, sales action, or even interactions with your customers in your digital products.
Traditional Multi-Touch Attribution
How might you use common sense to assign credit to each touch-point for a particular customer purchase?
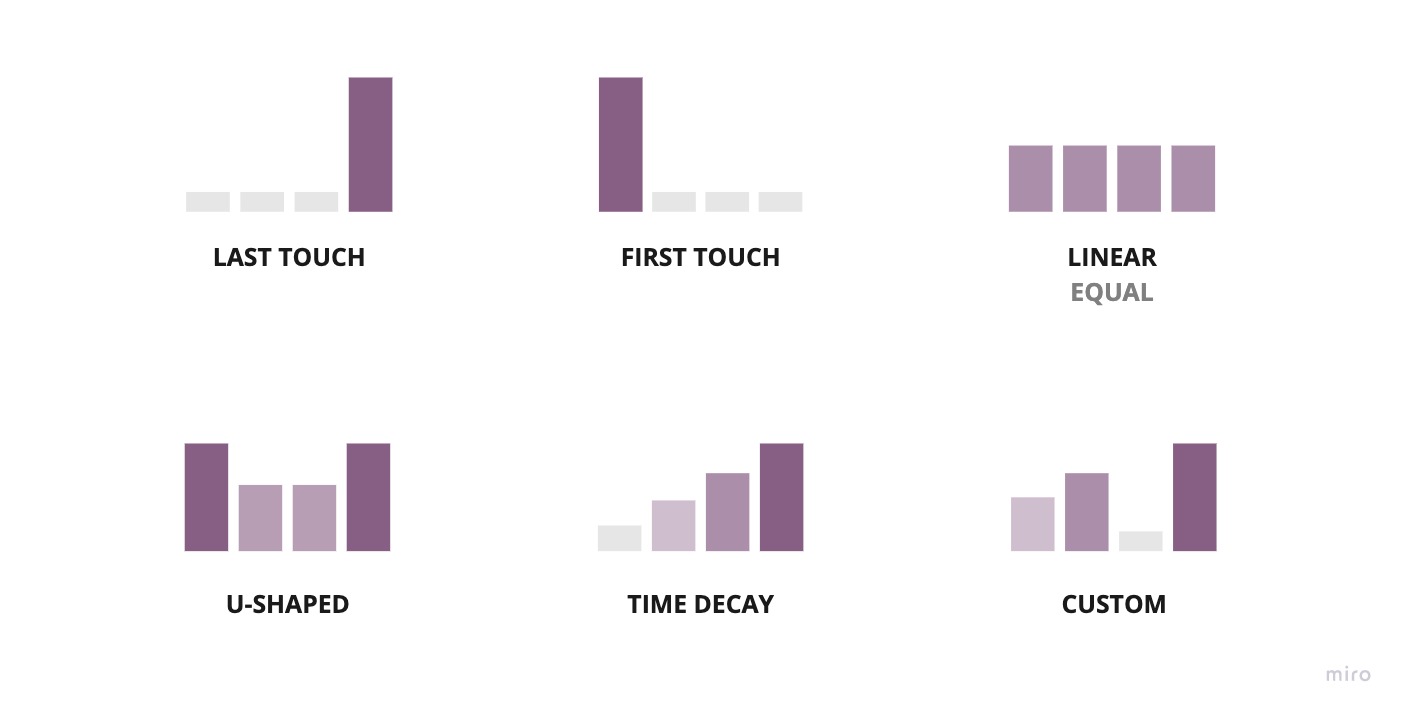
Depending on your perspective, you might apply different heuristics about the influence of each experience in the customer journey:
First Touch
100% of the credit assigned to the first touch-point because they got the customer into our world.
Last Touch
100% of the credit assigned to the last touch-point because that’s what made the customer take the final leap.
Time Decay
More recent touch-points get more credit because more recent touch-points probably do more to “warm up” the lead.
Linear
Why can’t we all be friends? Equal credit for all as long as you were involved in the conversion path!
U-Shaped
There’s clearly a balance between first-touch and last-touch thinking. Let’s give 40% credit to each of the first and last touches and distribute the rest evenly.
Custom
Every channel is unique, so I’m going to add weights to each channel based on how important I think it is.
What do all these heuristics have in common?
Well… we made them up, and that should make you feel at least a little uncomfortable. Indeed, this sentiment is echoed by the nearly 78% of marketers who are not sure if they’re using the correct attribution model.
You also have to be mindful that these can also be bent to serve one’s incentives. For example, if I have a lead generation business and I’m just running ads to a client’s website, it’s in my best interest to take 100% of the credit via a first-touch model and get paid accordingly💰 .
I say “traditional methods,” but that’s a misnomer because, unfortunately, this is the current state of the industry. More than 90% of organizations are not leveraging data to inform their attribution models, and about 1/3 of those don’t even attempt to track spend down to revenue.
Can we do better than guessing at this core business problem?
Data-Driven Attribution Approaches
Instead of coming up with the rules ourselves, we can let our data do the talking.
There are various types of models at our disposal to solve this kind of problem. The bulk of the literature around this topic tends to focus on 3 main approaches.
- Survival Models
- Shapley Values
- Markov Chains
Survival models transform the “effect of some treatment on time to death” problem from bio-statistics into an “effect of some touch-point on time to conversion.” The setup of the survival model requires several definitions and is beyond the scope of this post.
The Shapley model comes from the world of game theory and provides a fair way to distribute a payoff between participants of a collaborative game based on their level of contribution. Each touch-point can be considered a participant in a game, and the payoff can be modelled as the total purchase value across all customers.
Using Shapely values for attribution is a clever and intuitive approach with many useful properties. Still, the computational power required for the calculation grows exponentially with the number of touch-point types, making it unattractive for many companies with complex customer journeys. It’s worth noting that algorithms for efficiently approximating Shapley values do exist.
The last model standing is the Markov model, which is intuitive, resistant to noise, and scales quite well, so that’s what we’ll be focusing on today.
Regardless of which model you want to use, you will first need to instrument your business to capture prospect touch-point events. This can be tracking sales activities as tasks in Salesforce, marketing campaigns through automation software, or a bespoke data collection strategy ( interns? 🤨 ).
Simple Markov Attribution
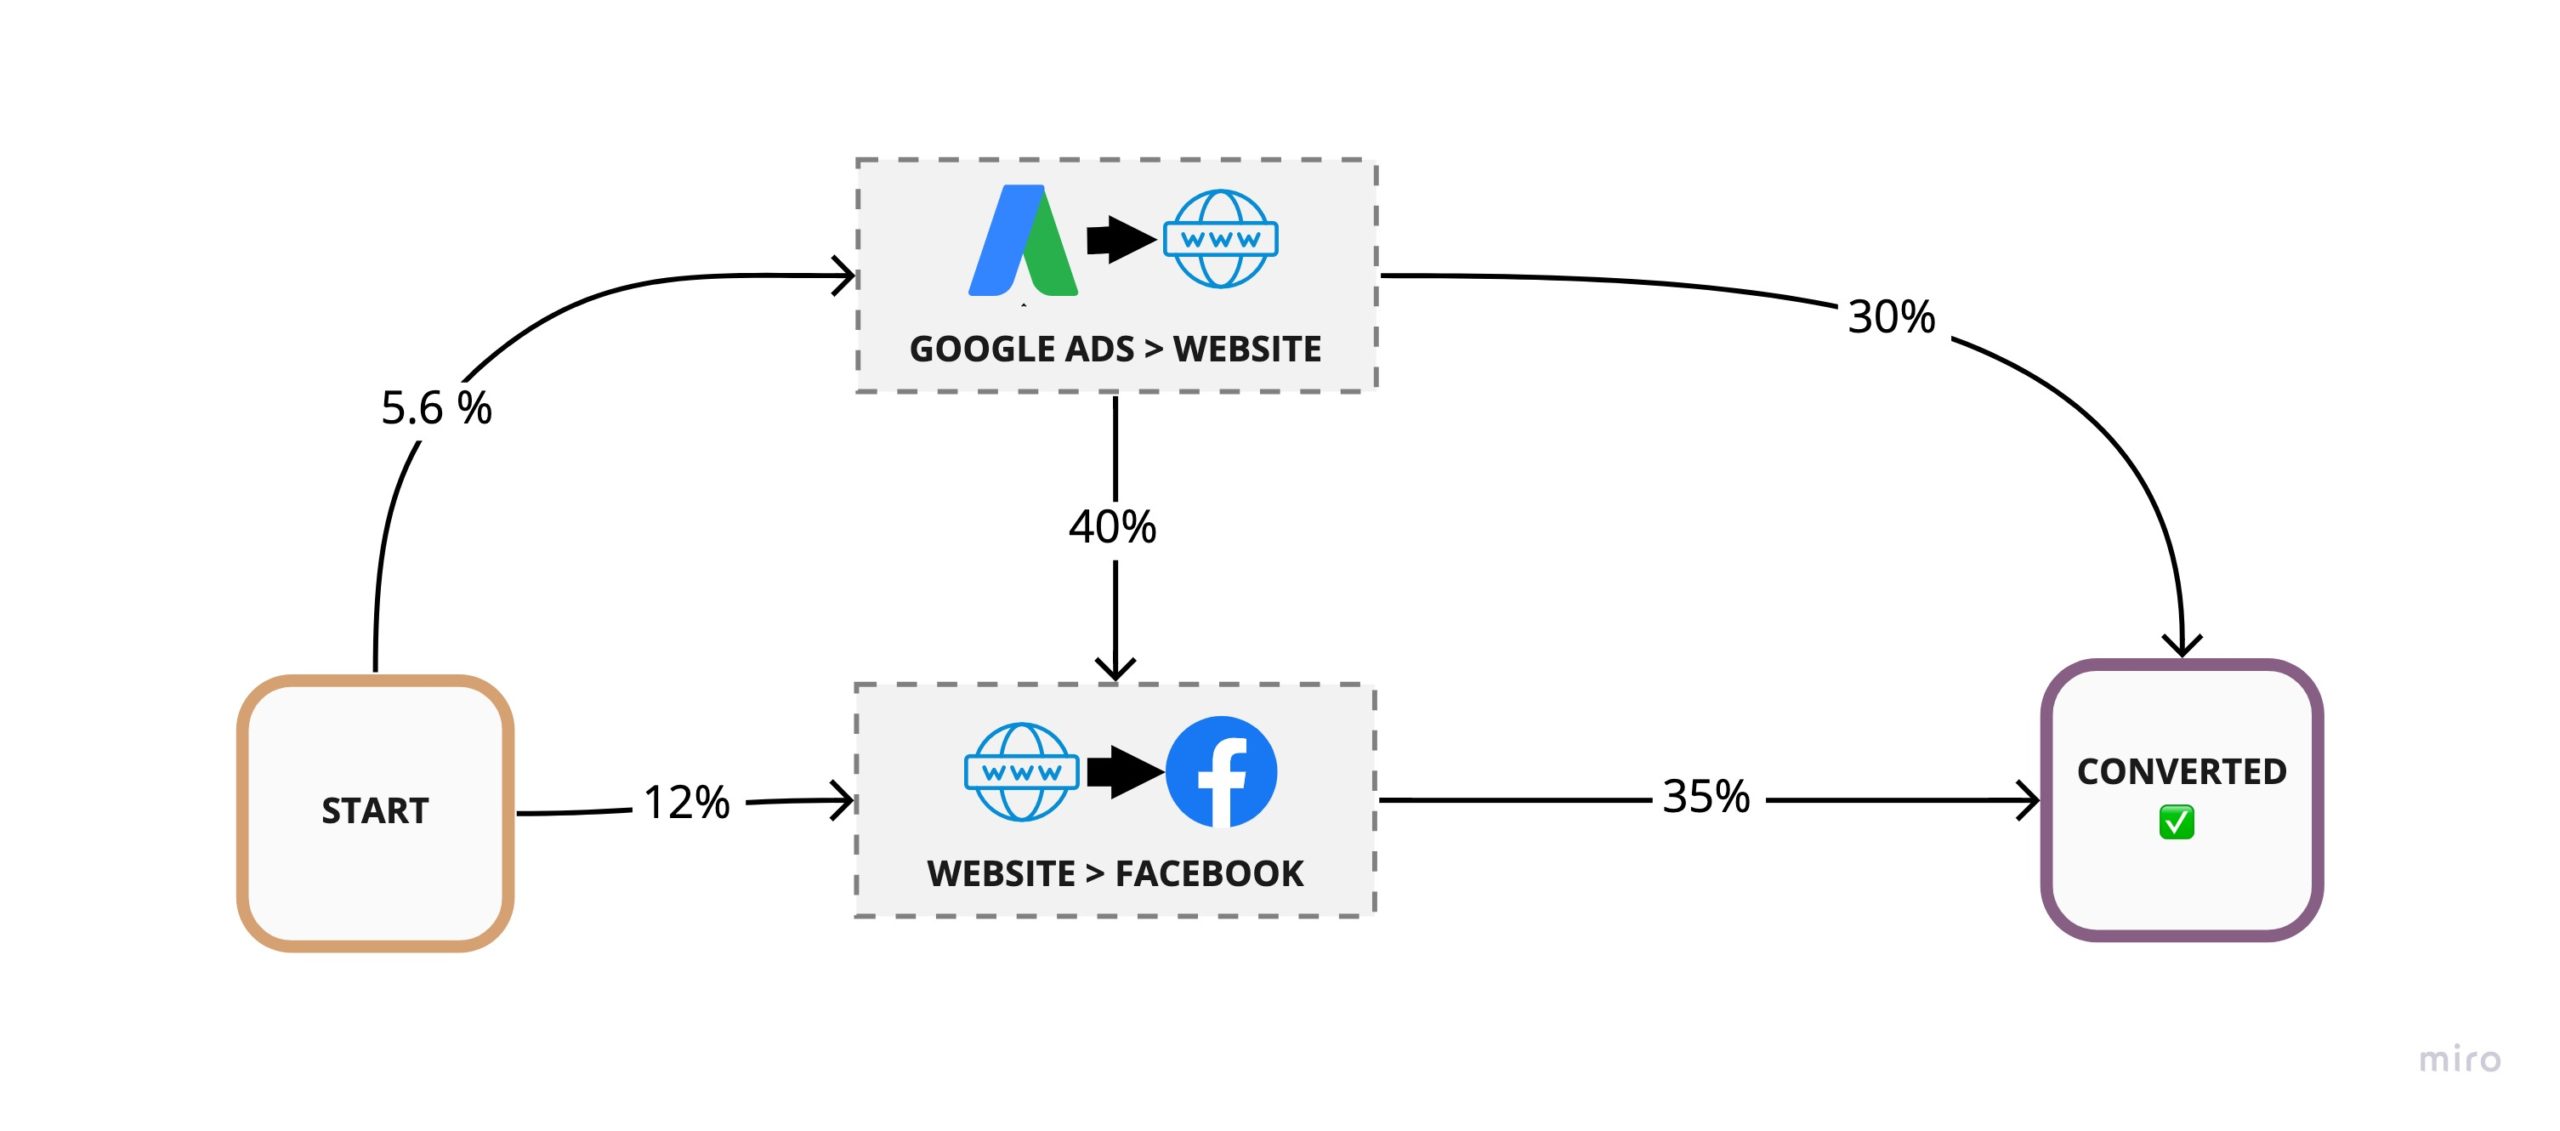
Once your data is in place, you can start building an understanding of the customer journey by following the order of their interactions with your business. By merely counting the number of customers that go from one interaction to another, you end up with the transition probability for each touch-point.
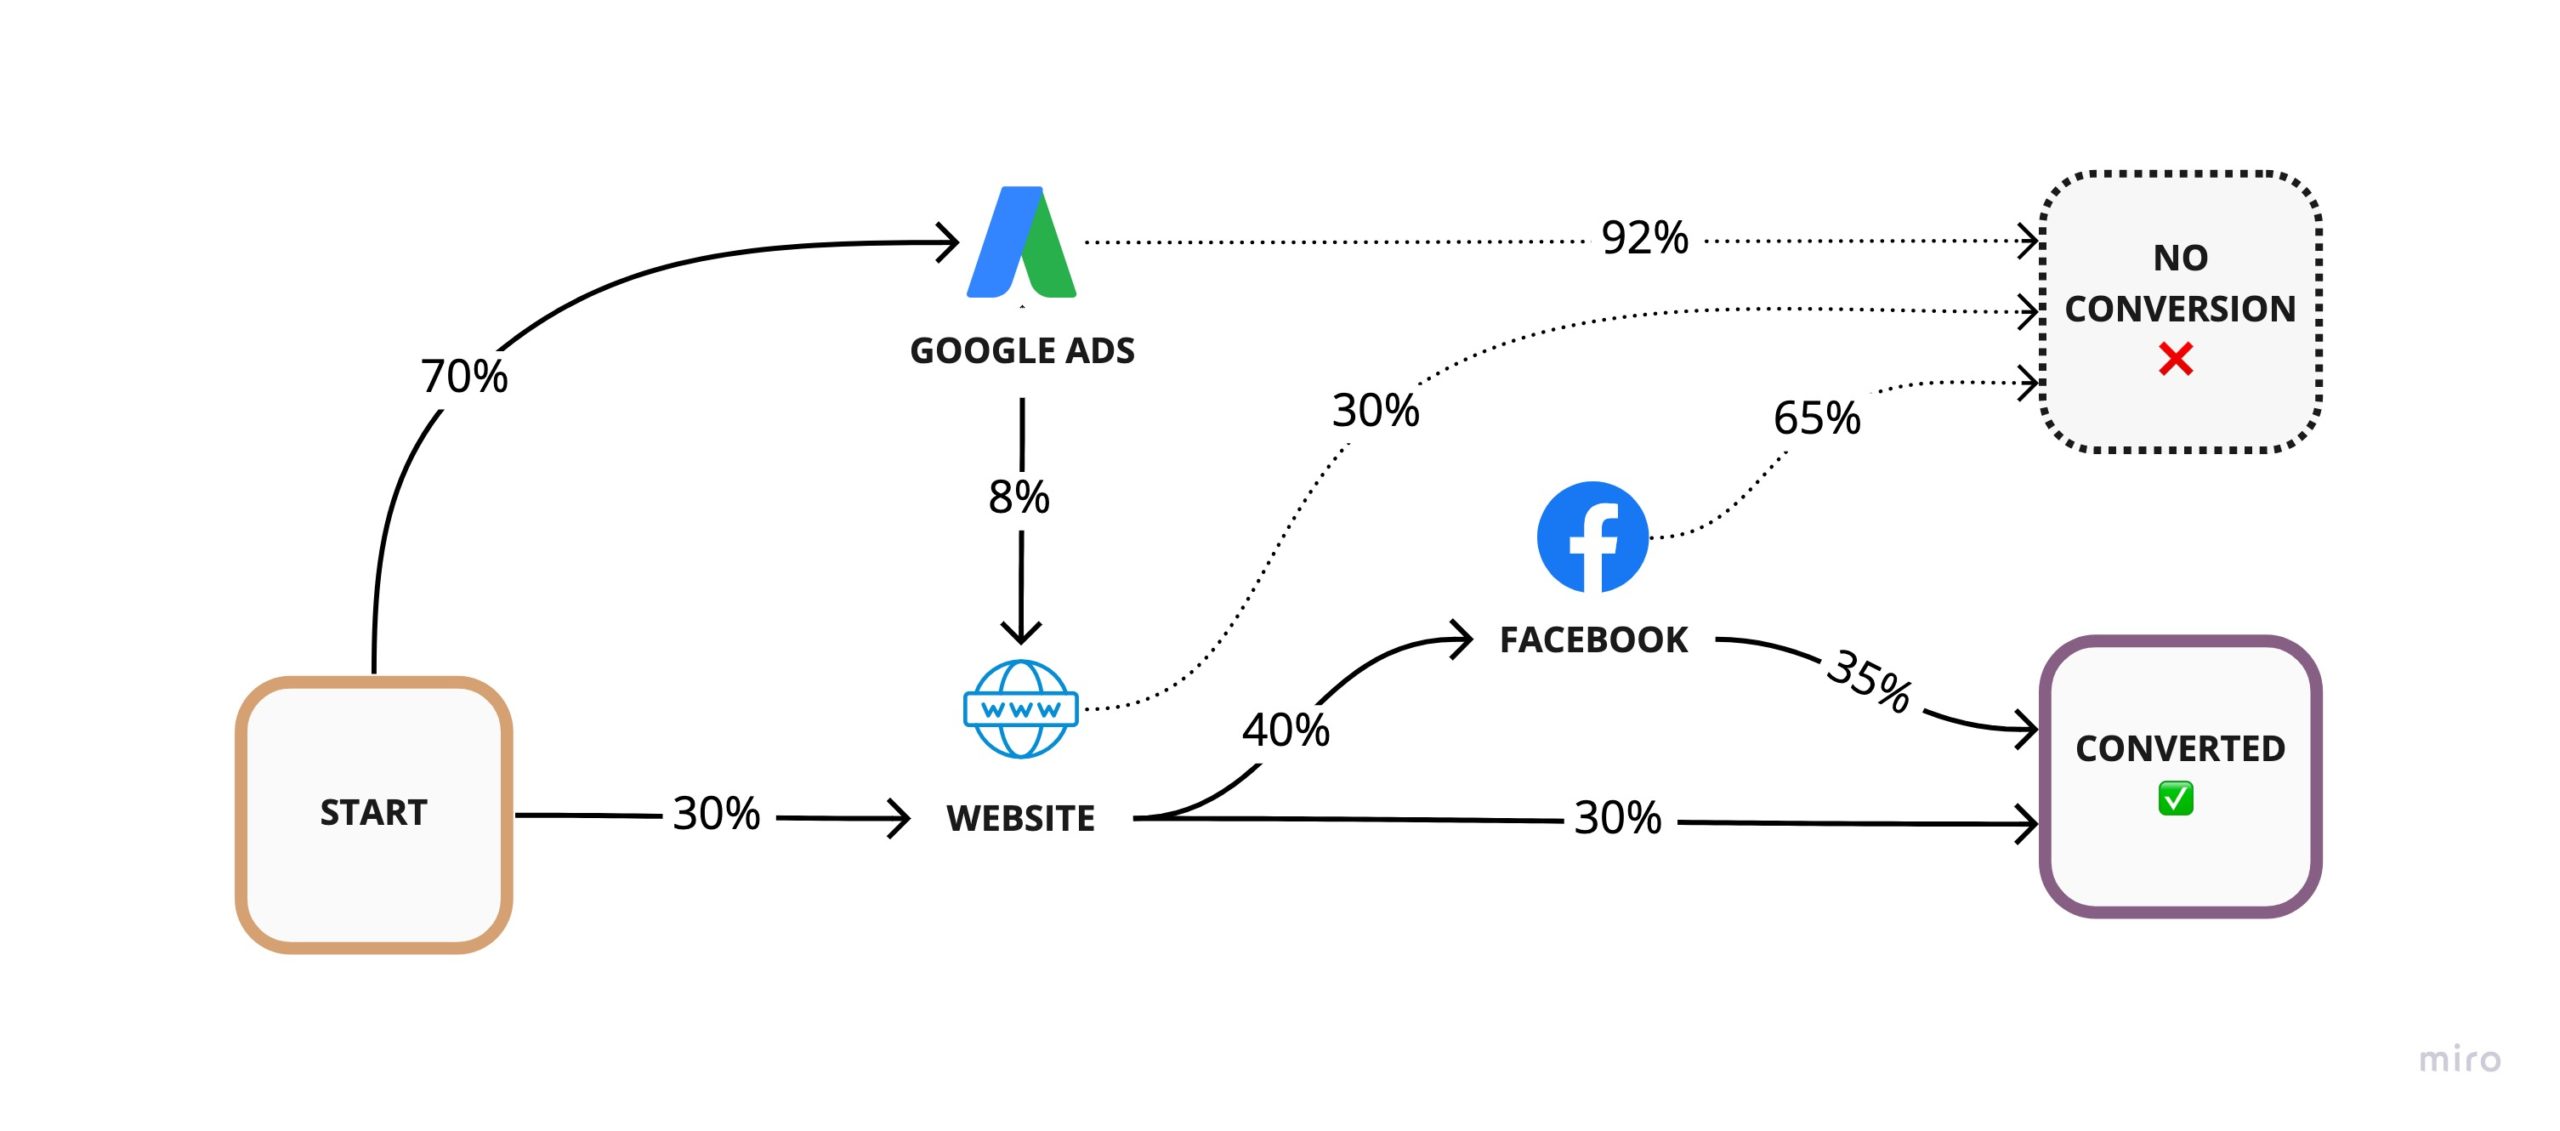
Now that we know the transition probabilities, we can estimate the number of conversions for a given number of prospects by following the chain of probabilities through all possible paths to conversion (just like a funnel).
For example, if I have 100 prospects, I can calculate the number of conversions as:
# Conversions =
  100 ⨉ 30% Website ⨉ 30% Converted +
  100 ⨉ 30% Website    ⨉ 40% Facebook ⨉ 35% Converted +
  100 ⨉ 70% Google Ads ⨉ 8%  Website ⨉ 30% Converted +
  100 ⨉ 70% Google Ads ⨉ 8%  Website ⨉ 40% Facebook ⨉ 35% Converted

= 15.664 Conversions
As you can see, we’re simply adding the effect of multiple funnels. The number of conversions for unique paths to conversion are additive and thus so are the conversion rates contributed by each path.
| Conversion Path | Probability Calculation | Conversion Probability |
|---|---|---|
| Start > Website >Converted | 0.3 ⨉ 0.3 | 0.09 |
| Start > Website > Facebook >Converted | 0.3 ⨉ 0.4 ⨉ 0.35 | 0.042 |
| Start > Google Ads > Website > Converted | 0.7 ⨉ 0.08 ⨉ 0.3 | 0.0168 |
| Start > Google Ads > Website > Facebook > Converted | 0.7 ⨉ 0.08 ⨉ 0.4 ⨉ 0.35 | 0.00784 |
| Sum (Overall Conversion Rate) | 0.15664 |
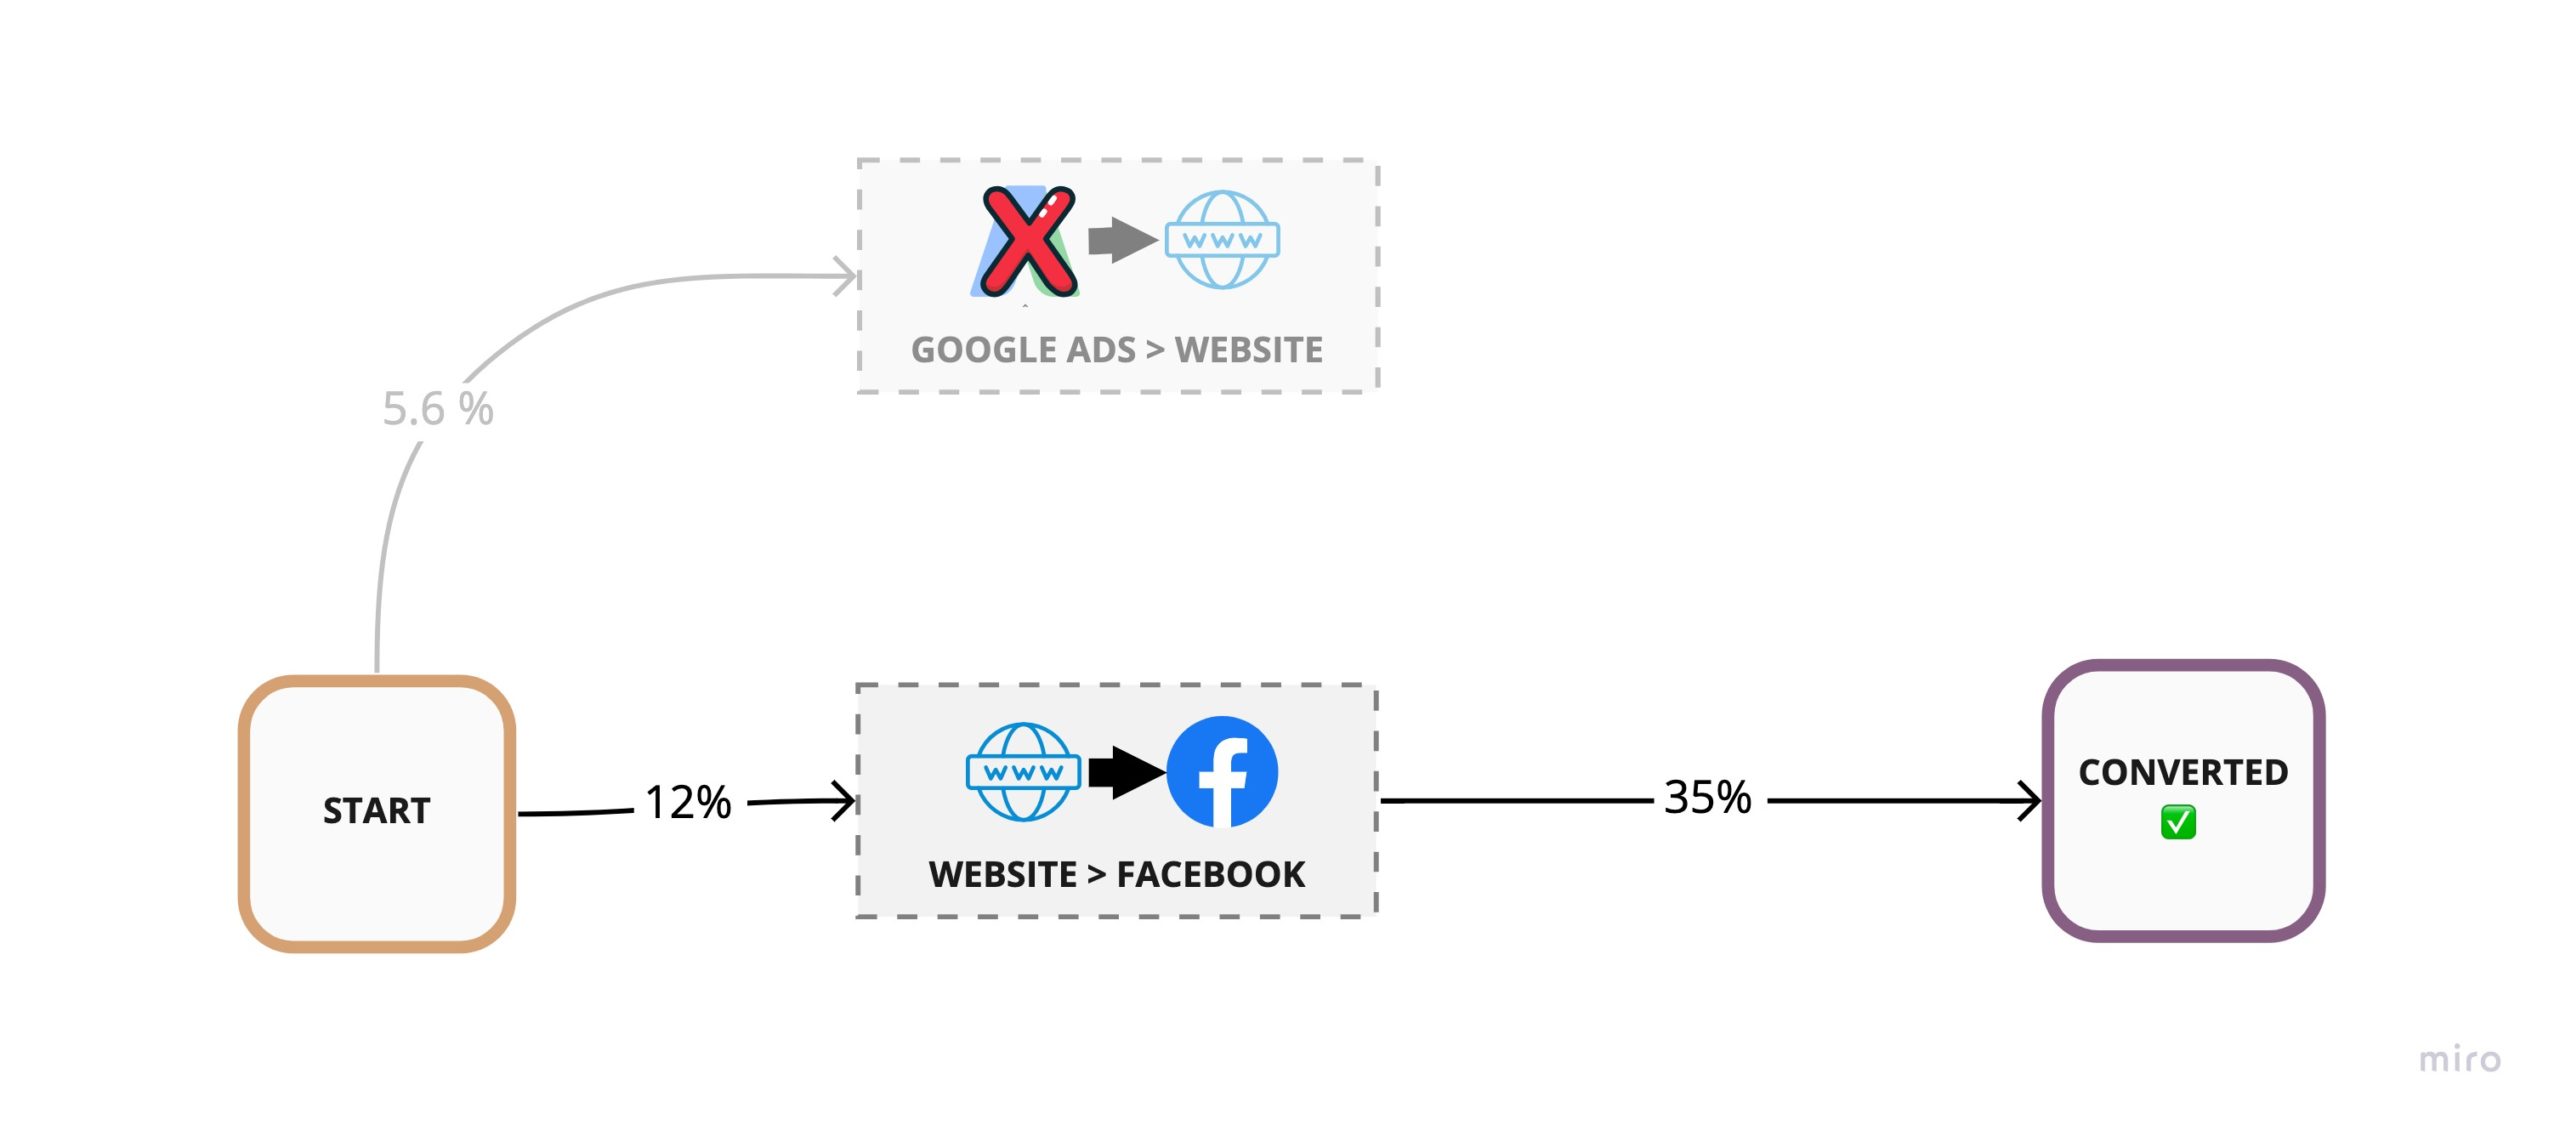
We have the contribution of each path to our overall conversion rate, but we still need to calculate the contribution from each touch-point. To do that, we can ask, “What would happen to my overall conversion rates if I just remove a touch-point?”
For example, we can remove Google Ads by effectively sending all traffic going out of that node into a black hole and calculate our conversion rate using whatever remains of our conversion paths.
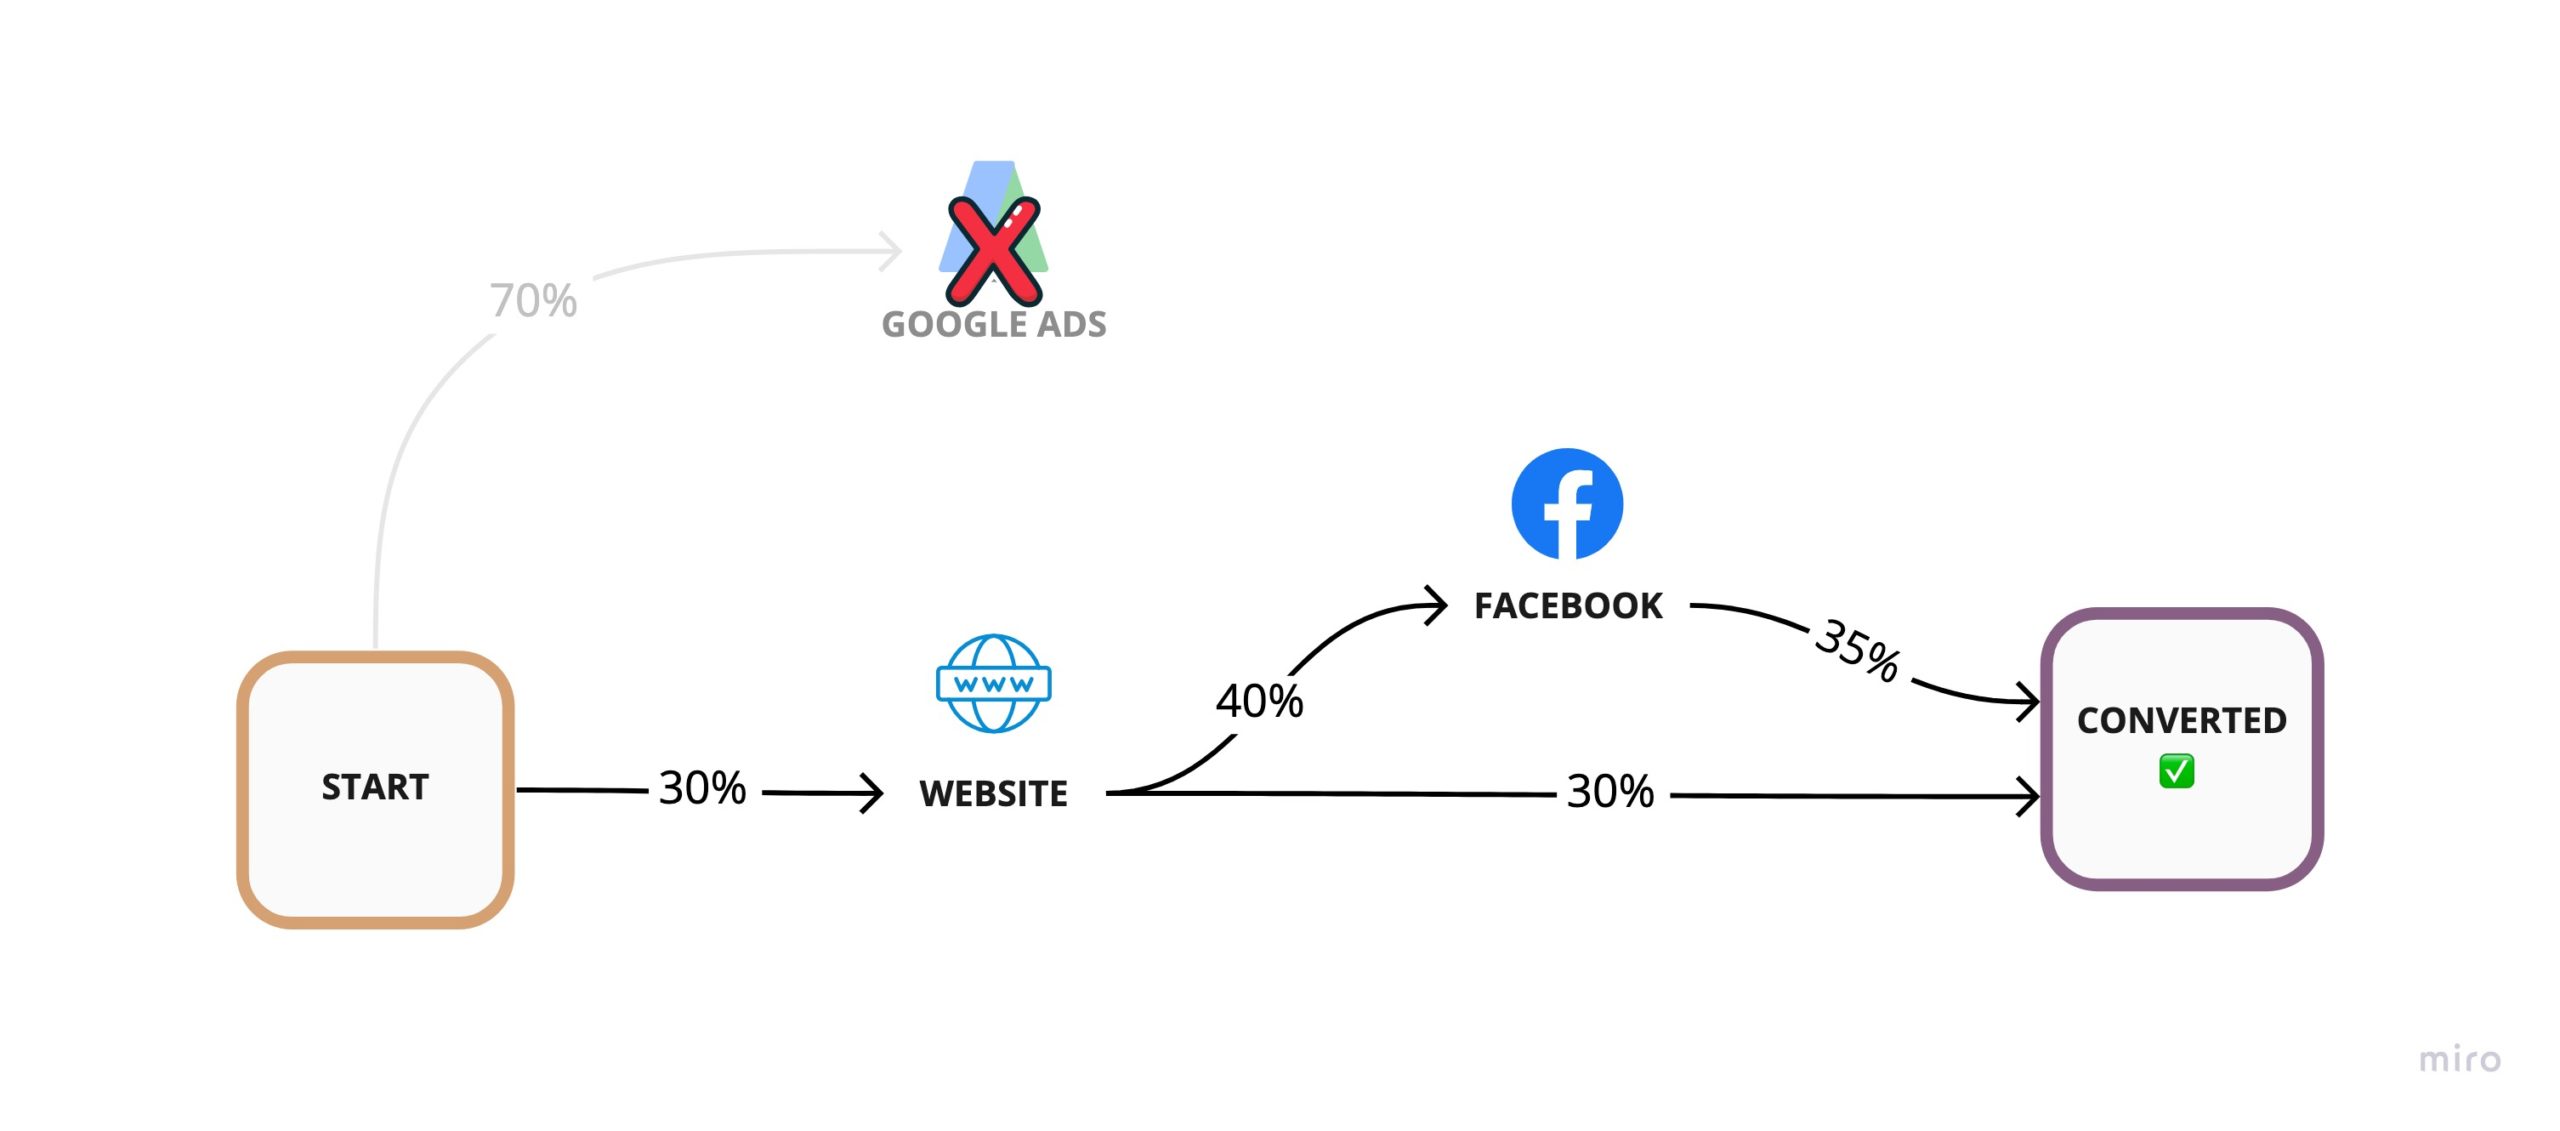
This hypothetical removal yields an overall conversion rate of 0.132
Overall Conversion Rate without Google Ads =
  Conversion Rate of (Start > Website >Converted) +
  Conversion Rate of (Start > Website > Facebook >Converted)
= 0.09 + 0.042
= 0.132
If our conversion rate without Google Ads is 13.2%, that means, Google Ads must have only been contributing 2.4% to our previous overall 15.6% conversion rate.
That’s only 0.024 / 0.156 = 15.38% of overall conversions.
This 15.38% value is known as the Removal Effect of the Google Ads touch-point and is a key number in calculating each node’s overall attribution weight.
The formula for calculating the Removal Effect can be summarized as follows:
- Rx = Removal Effect of touch-point x
- Cwith = Overall conversion rate before removal
- Cremoved = The conversion rate of the graph with touch-point x removed
Rx = ( Cwith − Cremoved ) / Cwith
= 1 − ( Cremoved / Cwith )
Can we simply use this Removal Effect as the weight of each touch-point and be done?
Not quite. But we’re very close.
To understand why we can see what happens if we remove the Website and calculate its Removal Effect.
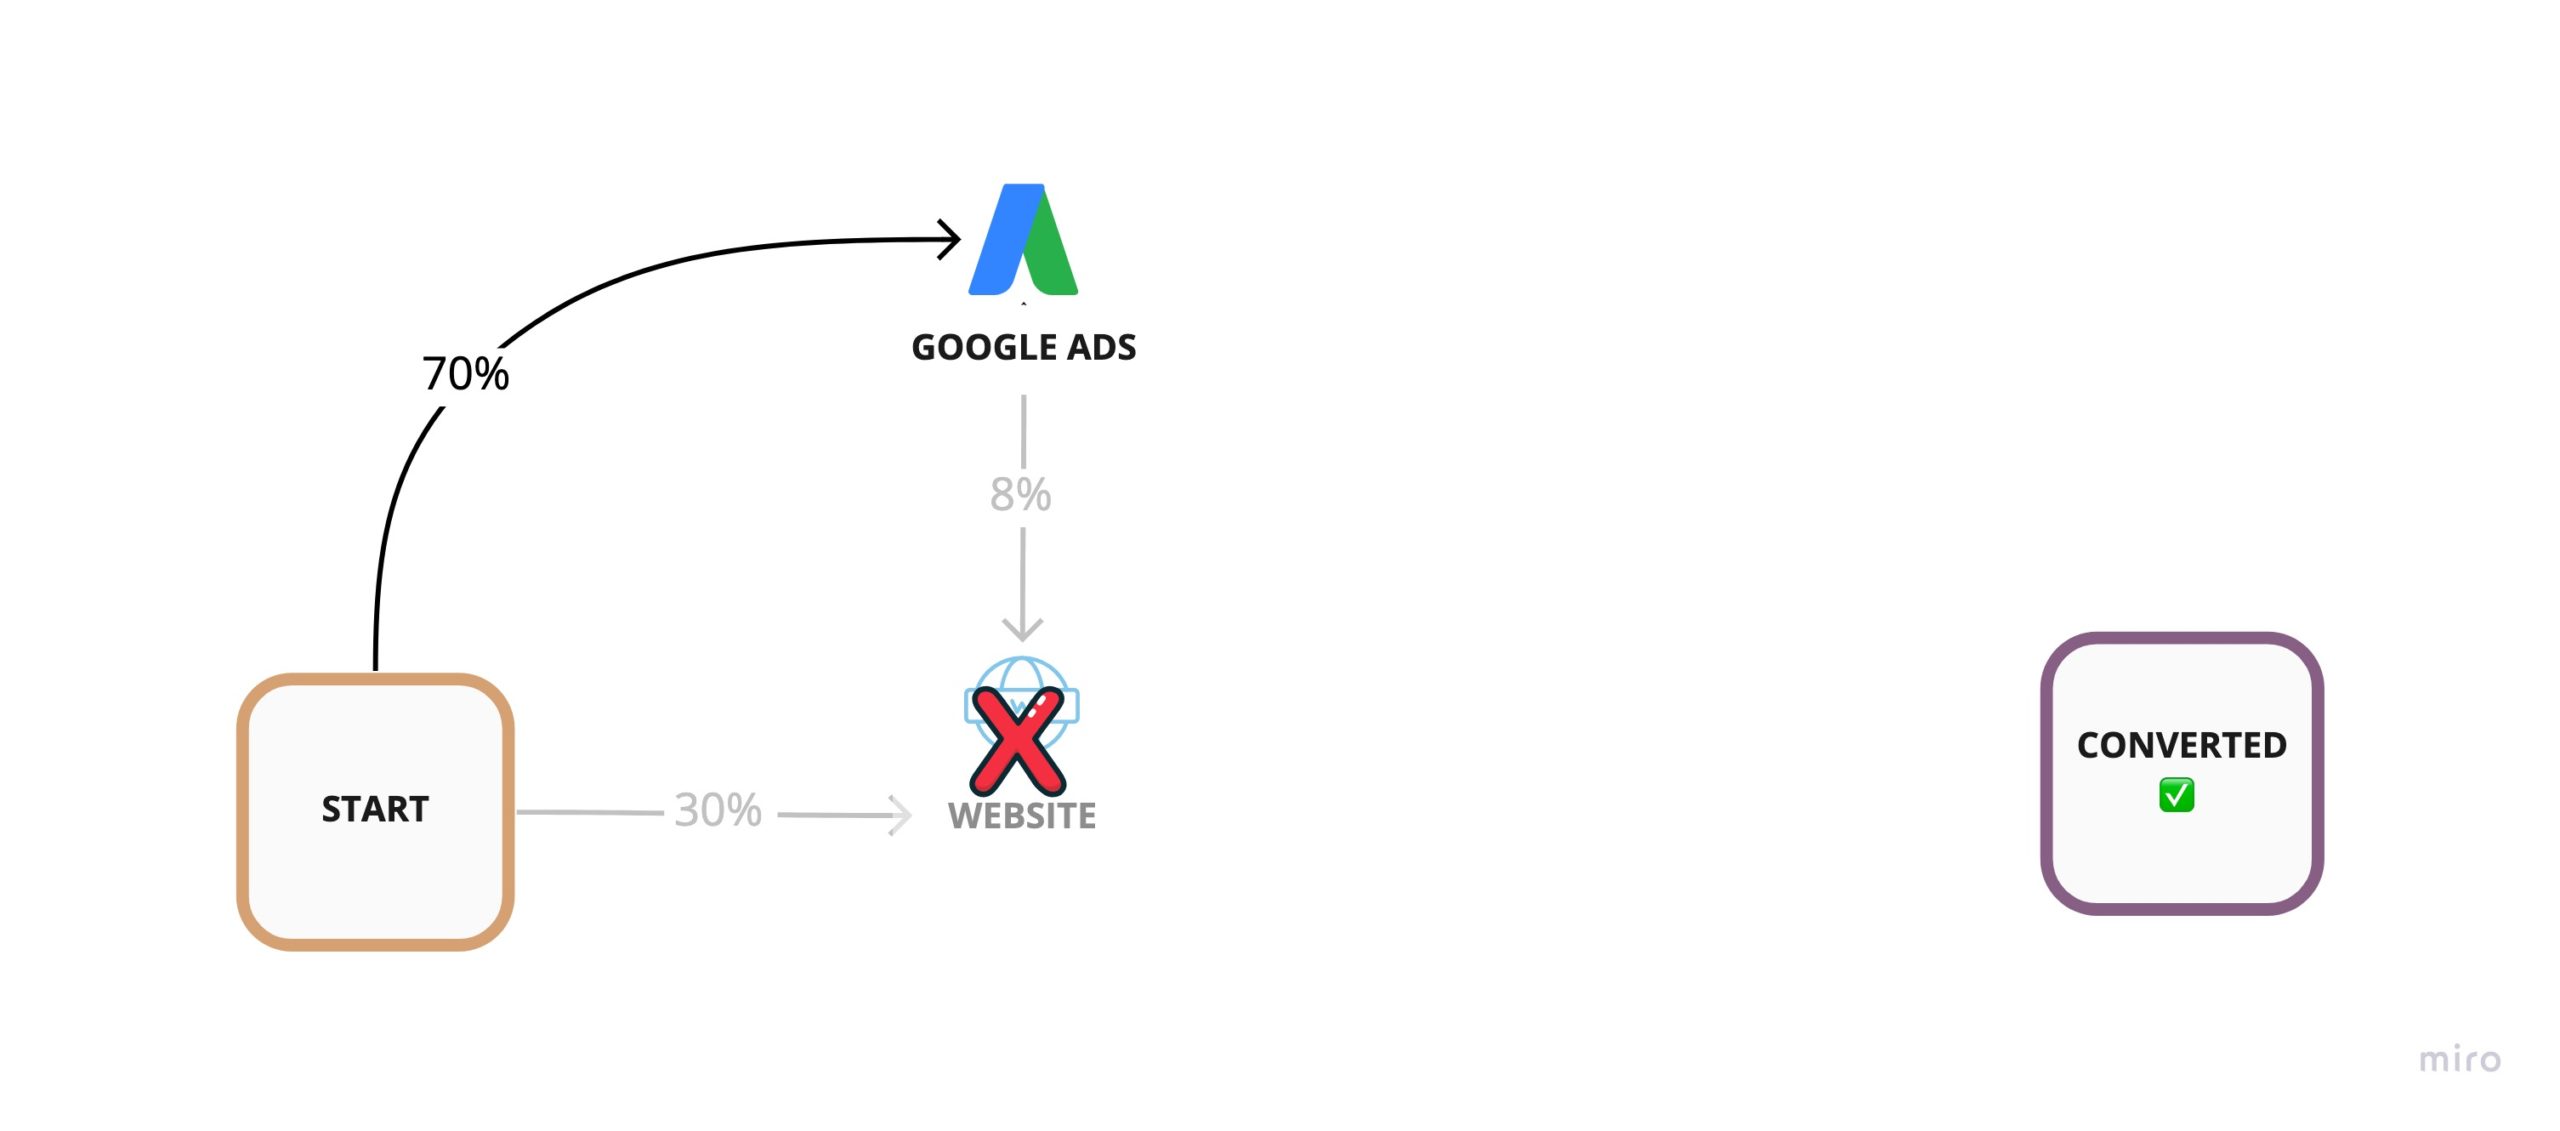
Every path goes through the website, so the Removal Effect would, of course, would be 100%. If we give the website an attribution weight of 100%, what would remain to attribute to the other touch-points?
This is why instead of using the Removal Effect directly, we can use a normalized Removal Effect by determining what proportion of the sum of all Removal Effects (RSum) a particular touch-point holds.
| Touch-point | Removal Effect (Rx) | Attribution Weight |
|---|---|---|
| Google Ads | 1 – (0.132 / 0.15664) = 0.1573 | 0.1573 / 1.4755 = 0.1066 |
| Website | 1 – (0 / 0.15664) = 1 | 1 / 1.4755 = 0.6777 |
| 1 – (0.1068 / 0.15664) = 0.3182 | 0.3182 / 1.4755 = 0.2156 | |
| Sum of Removal Effects (Rsum) 1.4755 | Sum of Weights 1 |
Now we have our weights! We can calculate our attribution value A by simply multiplying the attribution weight of each touch-point by the total conversion dollar amount V. This is usually the sum of purchase amounts, but I’d highly recommend you use Customer Lifetime Value instead if you want the full picture.
A = V ⨉ ( Rx / Rsum )
For example, assuming our customers spent $100,000 total, the attributed value to Google Ads would be $100,000 ⨉ 0.1066 = $10,660. If your marketing spend on Google Ads was less than that, you got yourself a positive ROI.
Markov Attribution Assumptions
The Markov model is extremely useful but it does make some assumptions you should be aware of.
The first assumption is that removing a particular touch-point doesn’t result in a shift in customer usage towards other channels. This assumption will hold most of the time, but you must consider how your business will be affected.
For example, if your customers are ending up on your Facebook page via Google search, removing Facebook would probably just shift that traffic to your website channel instead, since it would show up high in the results page.
The second assumption is that there is some underlying constant probability of transition from each channel to the next. In reality, different customers have different hidden transition probabilities. Analyzing your attribution effects over all customers really just gives you the attribution weights for the “average customer.”
It may be a useful experiment to repeat this exercise with different customer segments and identify similarities and differences.
Interestingly, you can extend the standard Markov model used here into a Hidden Markov model to infer the hidden states of each customer (such as whether they’re in “research mode” or “buying mode”).
The third assumption is that the transition probability at each touch-point only depends on the previous state. We know this is simply not true. A customer’s propensity to convert will surely be affected by order of touch-points in the customer journey.
This is why in practice, you consider not only the previous state, but two or more previous states. These are called Higher-Order Markov models.
Higher-Order Markov Models
For the case of 2nd Order Markov models, we go from looking at individual touch-points to considering them in pairs.
The 1st order path A → B → C → D becomes as 2nd order path of AB → BC → CD, and the transition probabilities of each higher-order path are simply the product of the transition probabilities along the lower-order path it was built from. For example
Even though we’re considering touch-points in pairs, we can still calculate the Removal Effect for a single touch-point by removing all nodes in the transition graph that contain that touch-point.
For example, removing Google Ads would result in the following graph:
We can continue with the other touch-points. Removing the Website touch-point voids all nodes and removing Facebook voids the bottom node. The math to calculate our attribution weights is the same as before.
| Touch-point | Removal Effect (Rx) | Attribution Weight |
|---|---|---|
| Google Ads | 1 – (0.042 / 0.06664) ~= 0.3697 | 0.3697 / 2.1176 = 0.17458 |
| Website | 1 – (0 / 0.06664) = 1 | 1 / 2.1176 = 0.4722 |
| 1 – (0.0168 / 0.06664) ~= 0.7478 | 0.7478 / 2.1176 = 0.3532 | |
| Sum of Removal Effects (Rsum) 2.1176 | Sum of Weights 1 |
It’s worth noting that you don’t typically see 1st order Markov models used for multi-touch attribution in the wild because we do care about having a longer “memory” of our touch-points.
Conversely, you will probably never encounter a Markov model of the 4th order or higher either, because you will have diminishing returns in accuracy at some point as you increase the order of the model.
Single-Touch Conversion Paths
Consider the following modified customer journey.
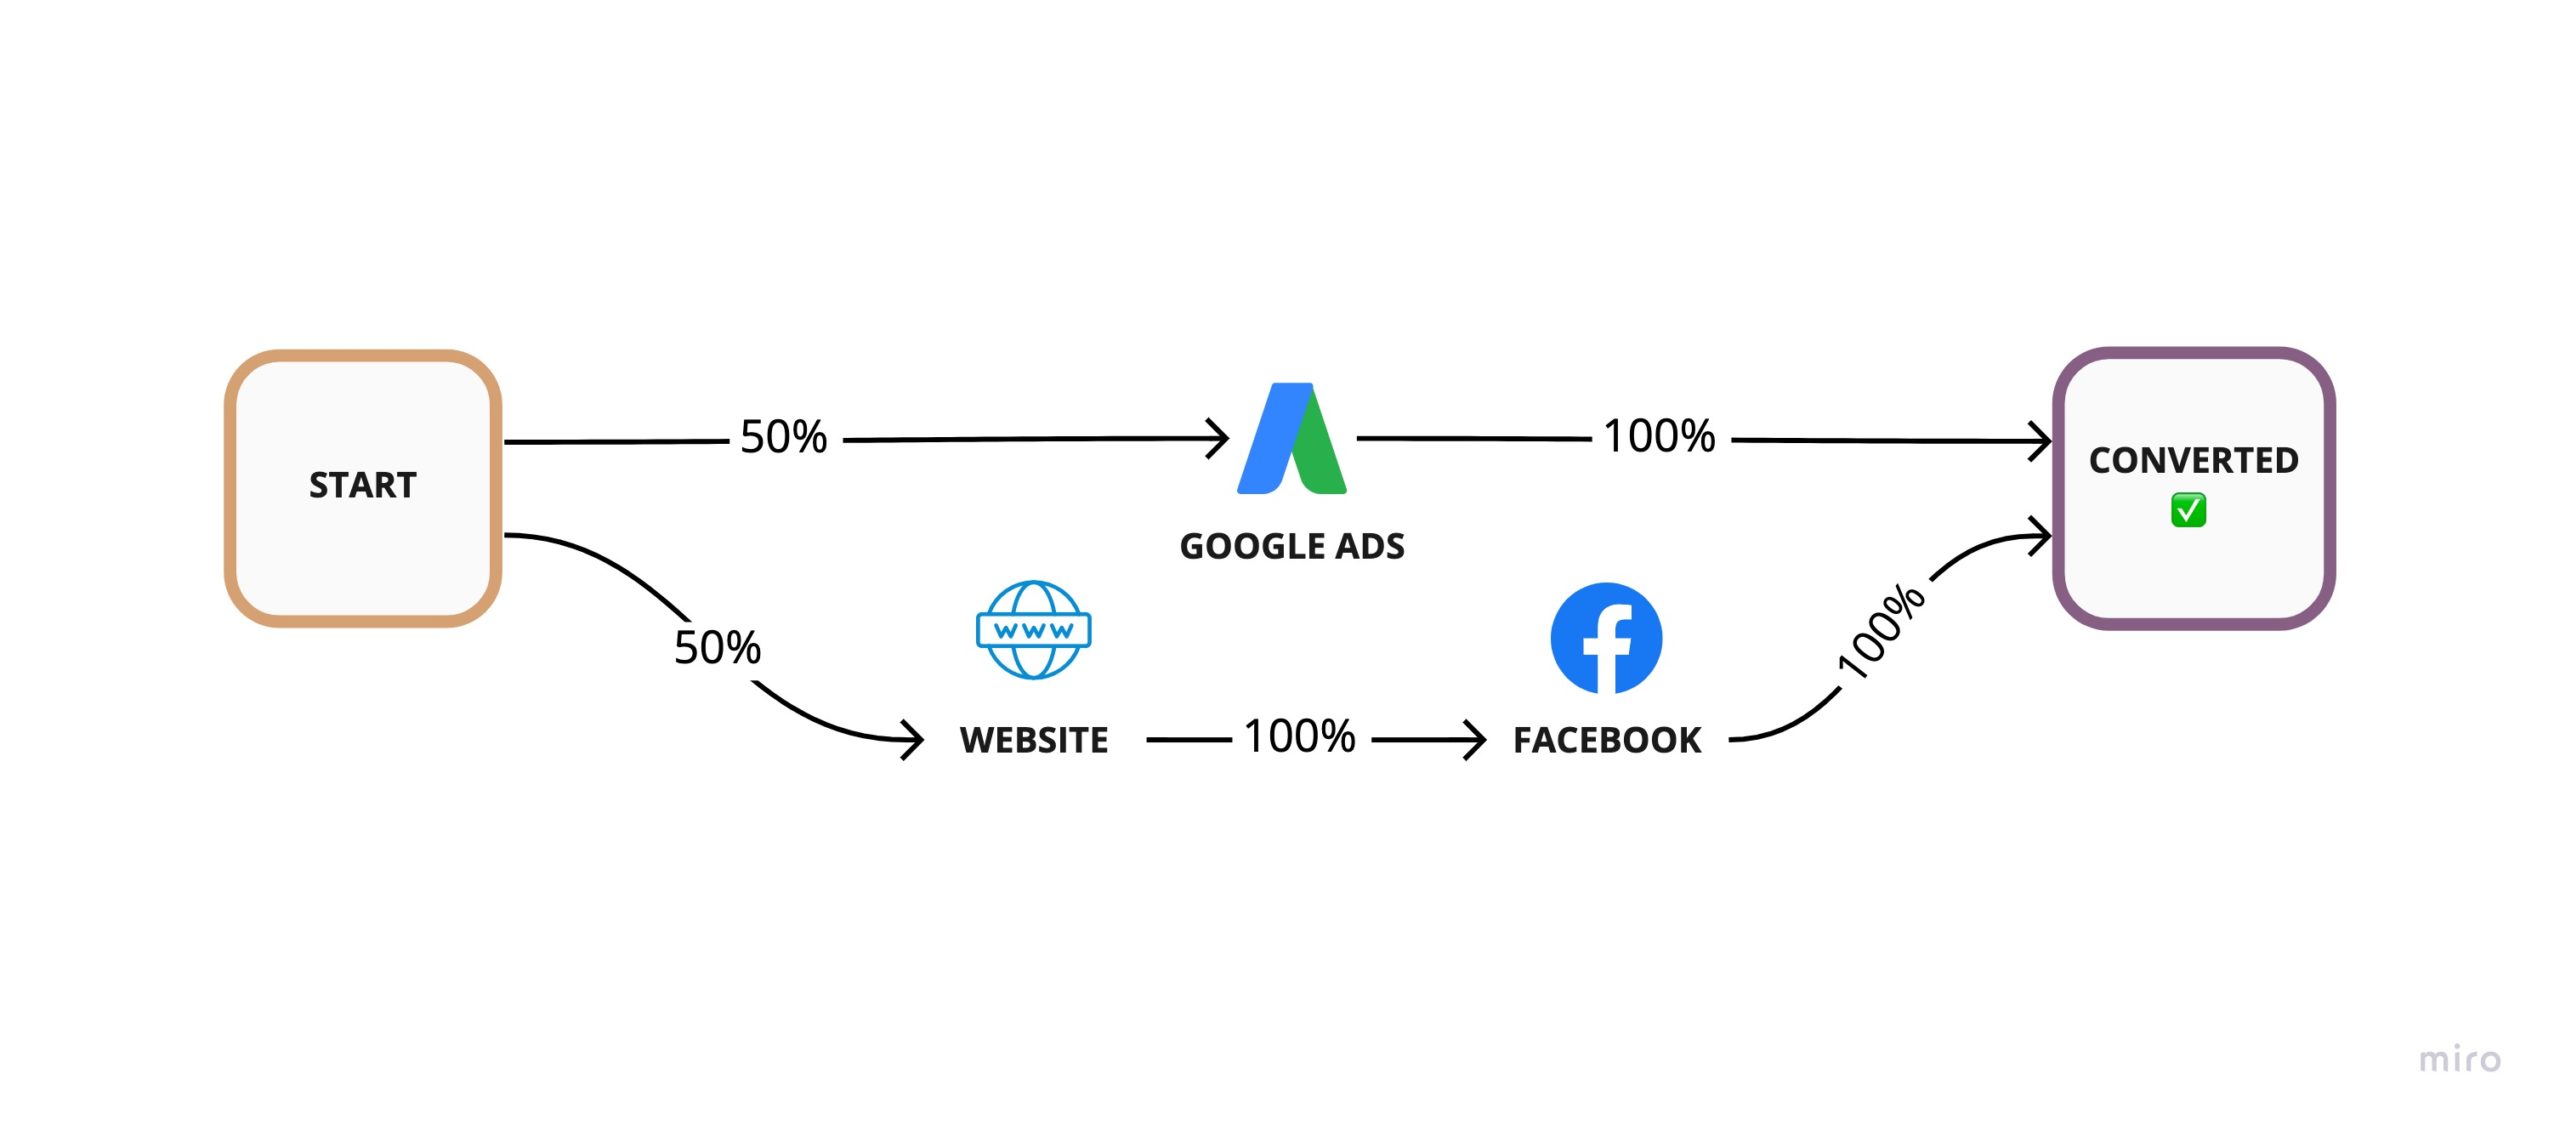
Let’s calculate the attribution weights for these 3 touch-points, but this time, we’ll calculate the number of conversions as well. We can assume 20 customers converted and see how the ideal multi-touch attribution split compares with the Markov attribution split.
| Touch-point | Actual Conversions | Removal Effect (Rx) | Attribution Weight | Attributed Conversions |
|---|---|---|---|---|
| Google Ads | 10 | 1 – (0.5 / 1) = 0.5 | 0.5 / 1.5 = 1/3 | 6.66 |
| Website | 10/2 = 5 | 1 – (0.5 / 1) = 0.5 | 0.5 / 1.5 = 1/3 | 6.66 |
| 10/2 = 5 | 1 – (0.5 / 1) = 0.5 | 0.5 / 1.5 = 1/3 | 6.66 | |
| Sum of Removal Effects (Rsum) 1.5 | Total Conversions 20 |
Notice anything weird?
It makes sense for Facebook and the Website to split some credit for their conversions, but why would they take partial credit for the Google Ads conversions when there’s absolutely no interaction with that channel?
This is a caveat of using a normalized Removal Effect. To get around this issue in a real deployment, you can remove single-touch paths from your analysis and use a higher-order Markov model on what remains. You can then simply add in the conversion from single-touch journeys since their contribution is obvious and no modelling is required.
Reality Check
Throughout this post, we’ve been operating under the assumption that data-driven models will be better than traditional models. While this is probably true in most cases, can we measure how much better they are? For that matter, how can we compare one multi-touch attribution model with another?
The difficulty in assessing any attribution model’s effectiveness is that the “ground truth” of attribution weights is hidden to us, so we can’t tell how far off we are from reality.
One interesting way to solve this is to create a simulation of your customer interactions by incorporating data from your business and domain knowledge from your experts.
By looking at your customer touch-points closely, fitting statistical distributions over your data, and modelling the interaction between variables, you can create simulated data closely resembling your production data. The final piece of the puzzle is the simulation’s attribution weights, which can come from your experts, and will be used as the “target” for your attribution models.
Domain experts will likely not pinpoint the exact attribution weights of each touch-point accurately, but they should be able to provide a valid 90% confidence interval. You can use the distribution of the attribution weights from domain expert estimates as an input to a Monte-Carlo simulation to calculate the distribution of errors for each attribution model, provided the attribution weights for all touch-points in each scenario sum to 100%.
At this point, you can put attribution models head-to-head and see which one is closer to the mark. You may also test many “what if” cases and stress test each attribution model in multiple scenarios to measure how they adapt to different hypothetical conditions unique to your business. These simulated scenarios also provide a much quicker feedback mechanism for you to tune your attribution models.
Where to Go From Here
The biggest hurdle to getting started with this model is not the complexity of the calculations; it’s instrumenting your business to collect the data and subsequently getting all the data in one place for analysis. With a bit of perseverance, this can be done.
If you’re in marketing, you’re in luck because there are software vendors like Bizible, Attribution, and Rockerbox that can help you connect to your data and build attribution models for you.
In some cases, off-the-shelf software is not flexible enough to handle your data collection or modelling needs. In these cases, you need to start looking at rolling your own solution.
You don’t need to start from scratch here either. Python and R packages like ChannelAttribution will fit a model for you with a few lines of code.
Attribution modelling is a rich and fascinating topic. In this post, I zoomed in on Markov models, but I implore you to check out the Shapley method because, despite the computational challenges, it has many desirable properties.
Bottom-up modelling using conversion paths is also not the only way to do data-driven attribution. In some cases, it may be prohibitively difficult to measure the touch-points, as with billboards and radio ads. The shifting landscape of cookies and digital stitching comes with its own set of challenges.
Top-down approaches like Marketing Mix Modelling provide an alternative way to calculate attribution when working with aggregated information. This family of models is interpretable, scalable, and optimization-friendly but may demand a hands-on approach to modelling.
Most of the models mentioned provide a way of capturing the correlation between a particular touch-point and conversions, but in order to say that a particular touch-point caused a conversion, you can run controlled experiments (A/B tests) and calculate the conversion lift for that touch-point.
This may not always be feasible in practice due to the high cost and complexity of running multiple experiments in a dynamic business environment. There are, however, other methods for determining causality beyond controlled experiments, which use causal networks as their foundation.
As you can see, this is a hot topic, and we’ve barely scratched the surface, but starting on the learning path towards using any of these data-driven multi-touch attribution methods will likely give you a substantial competitive advantage over the vast majority of contenders using traditional methods.

3 Responses
Amazing analysis.
Thanks.
Looking forward to your next chapters reviewing all the market products giving Markov Model for attribution (Hint Hint).
Thank you for writing about attribution. This has been, and will continue to be, a key topic and challenge for digital marketers… I enjoy every article and conversation on the subject.
Amazing article. Although I work in MTA professionally this article caught me by surprise with the amount of insights it has. The idea of using higher order markov chain for single touch point journeys is very creative.
Please let me know if there are any more such articles which can help me understand diminishing returns as well.
Cheers!!