Conversion rates, or the percentage of people taking some desired action in your business, are among the most fundamental metrics you need to be aware of.
Track the conversion rates over a series of steps, and you have yourself a (conversion) funnel.
Looking at each step’s conversion rates can be critical for identifying bottlenecks and identifying issues with steps in your process; moreover, looking at the funnel as a whole gives you a mathematical engine that tells you how many outputs you can expect to derive from inputs into your process.
The latter is very useful when you know how many outputs (e.g. deals) you want and need to find out how many inputs (e.g. leads) you must provide to your process to achieve your target.
This post aims to highlight the hidden assumption you make when using conversion rates for planning, and my hope is to provide you with the tools you need to ensure your targets are consistently met.
The Mystery
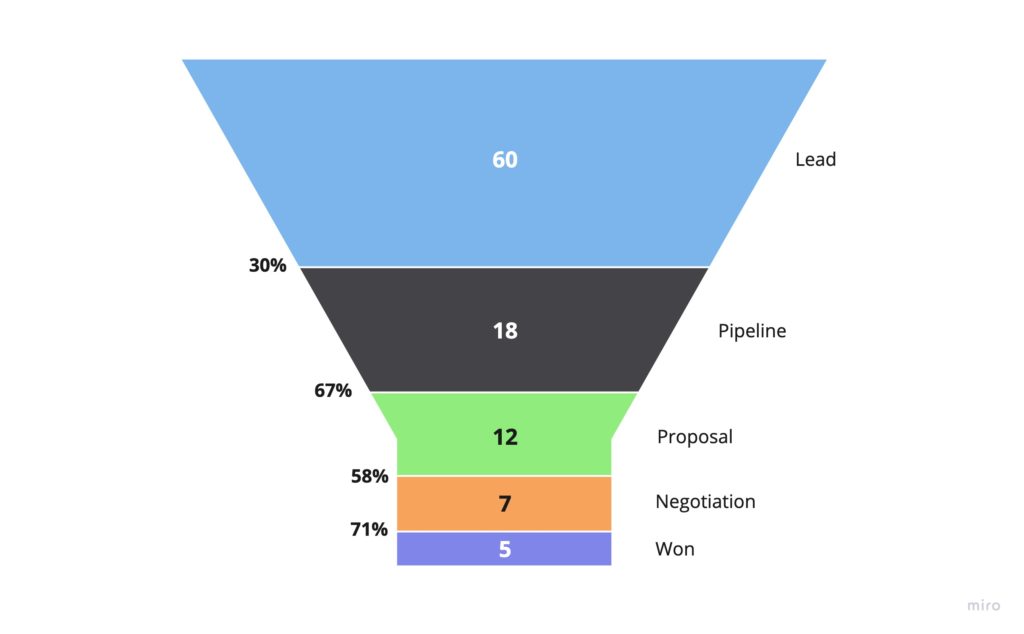
Consider the following sales funnel. You can see the number of leads that made it to each stage in the middle, and on the left, the conversion rate from one step to the next.
As a data-driven manager, you turn to science to determine the number of leads you need to hit the target of 20 deals next quarter.
You set your target deals “Won” to 20, and start working your way back through the funnel and dividing by the conversion rates at each step.
Leads Needed =
  # Target Deals
  ➗ (% Negotiation → Won)
  ➗ (% Proposal → Negotiation)
  ➗ (% Pipeline → Proposal)
  ➗ (% Lead → Pipeline)

Leads Needed = 20 ➗ 0.71 ➗ 0.58 ➗ 0.67 ➗ 0.3 = 241.6 ~= 242
You get the team together and announce the new target of 242 leads and secretly pat yourself on the back for using data to set the target. Next quarter rolls around, and you’ve even exceeded your target leads and brought in 250 leads at the top of the funnel. Things are looking great!
At the end of the quarter, you take a look at your reporting and see that you only have 13 deals.
Your processes didn’t change, and the quality of your leads should have been the same. Your sales team had more than enough capacity to process 250 leads, and there is no evidence that their performance is slipping.
Was this just bad luck, or was it bad planning?
The Illusion
The assumption at the heart of this problem was a false assumption that was taken to be true, even though deep in your heart, you probably knew it wasn’t.
False Assumption
Your measured conversion rate is the same as your actual process conversion rate.
Look at the Q1 conversion rates again. Which stage’s conversion rates do you think will most closely represent the real underlying value for the conversion rate of all leads going through that stage? Conversely, which one is the most suspect?
We can be most confident that the conversion rate for Lead → Pipeline will be the most stable in subsequent quarters because we have the highest number of samples for that stage. Similarly, just as you wouldn’t trust a 5-star review on Amazon for a product with 3 ratings, you probably can’t really trust your 5 of 7 Negotiation → Won.
You can actually quantify the uncertainty around the underlying conversion rates at every step using the Beta distribution, which I’ve written about before. If you want to build your intuition about its derivation, I highly recommend watching this 3Blue1Brown video.
Luckily, you can use a free online tool to get the range of possible values for each conversion rate that could have produced the data we saw. In other words, we’re moving from using point estimates of our variables to defining a distribution of potential values each can take.
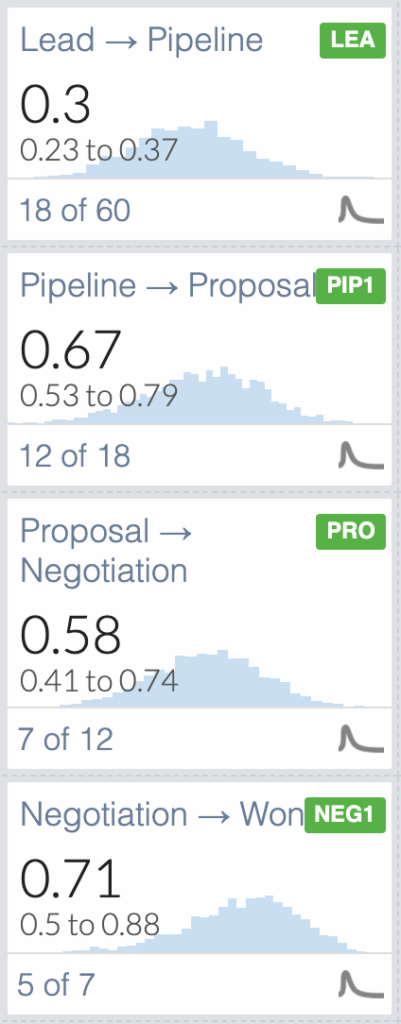
In the above figure, you can see that for our 71% Negotiation → Won conversion rate, there is a 90% chance that the data that we see (5 of 7) could have come from an underlying conversion rate anywhere between 50%-88%.
What is quite unsettling is that even with our sample of 60 for Lead → Pipeline, the potential range is still quite wide (23%-37%).
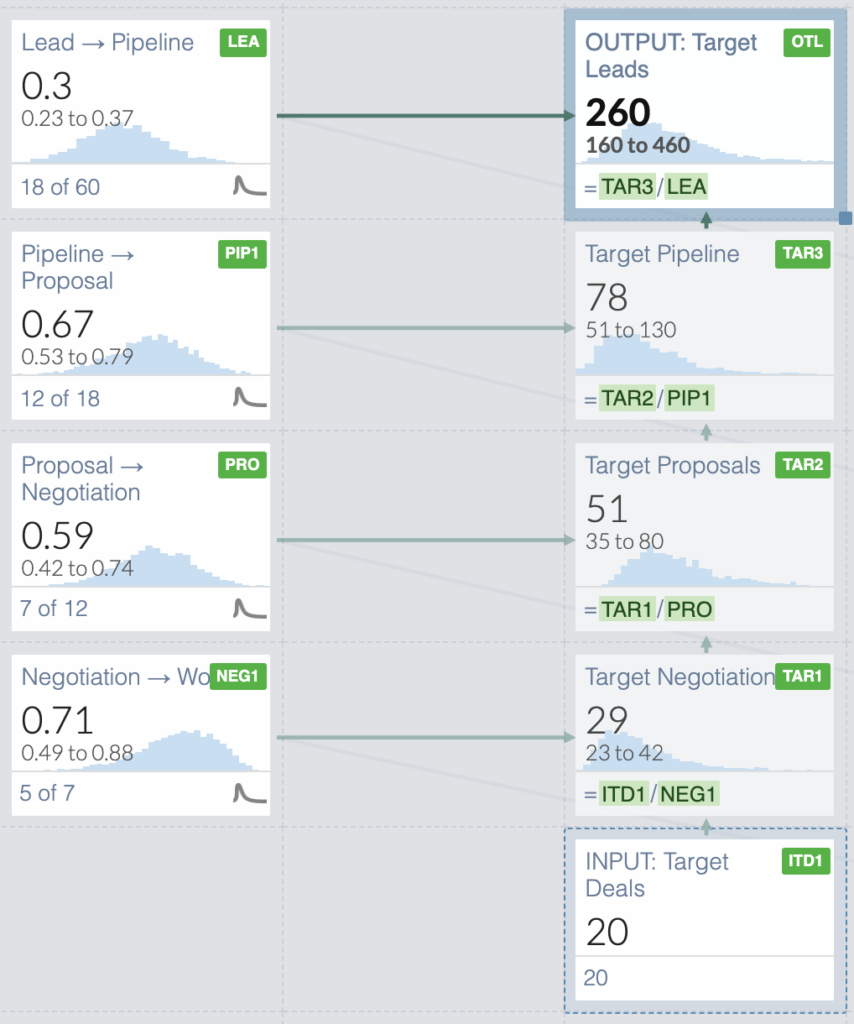
Now, if we take our original “Leads Needed” formula and calculate it thousands of times using all possible values each variable can take according to its distribution (a process known as Monte Carlo simulation), we will end up with a distribution of potential outcomes.
Concretely, from the thousands of scenarios we evaluated, we’ll know the range of the number of leads that can produce 20 deals and how likely each scenario is.
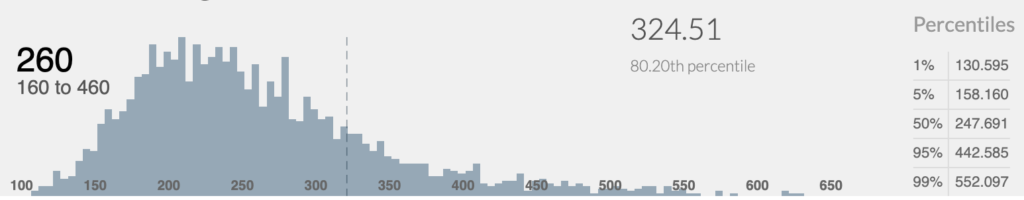
By zooming into the distribution of “Target Leads,” we can see that there is actually a 20% chance (1 in 5) that we’ll need more than 325 leads and a 5% chance (1 in 20) that we’ll need more than 440!
So… was this bad luck or bad planning? It turns out it was a bit of both.
Bad luck we can do nothing about, but planning is something we have control over. With some minor tweaks, we can ensure that luck has little do with our desired outcome.
The Remedy
What if, instead of asking “How many leads do I need given a target of 20 deals,” we ask “How many leads would guarantee at least 20 deals?”
We can define “guarantee” as having a 90% chance of hitting our target.
Utilizing the same distribution of target leads, we can see that in order to get 20 deals in 90% of the scenarios (the 90% percentile) we need at least 385 leads.
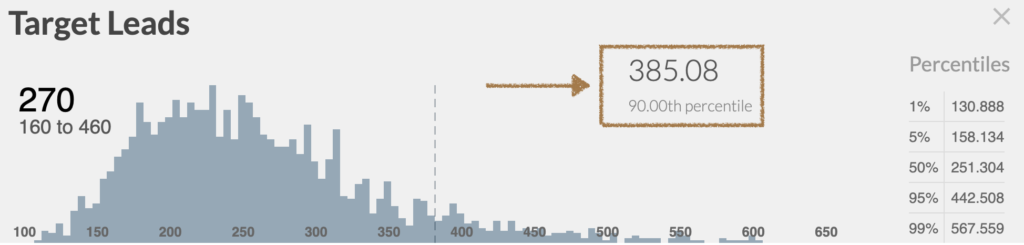
90% confidence might be right for most of you, but in some scenarios, achieving your target might be critical, and 90% confidence just won’t cut it. In those scenarios, you can increase your “guarantee” to 95% or 99%, but now you’re looking at 443 and 568 leads, respectively. In other words, the model is telling you, “You want to be very sure? Then, overshoot your target by a mile!”
One last thing to note is that the reason there is such a wide range of uncertainty about your target leads is that you are operating with a small number of samples (60 total) from the previous quarter to do your planning.
Let’s say for a moment you had 4x more data by using the last 12 months’ conversion rates instead. Assuming we keep the conversion rates constant and simply quadruple our data, let’s see how that affects our confidence in the target number of leads.
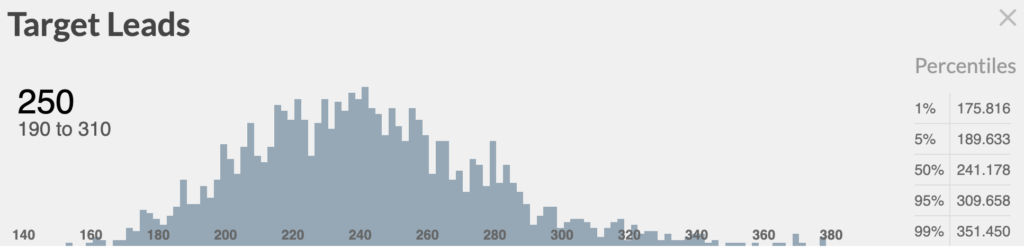
We now have a much tighter range on our estimation of the number of target leads. In fact, we can say with 95% confidence that only 310 leads are required to get at least 20 deals.
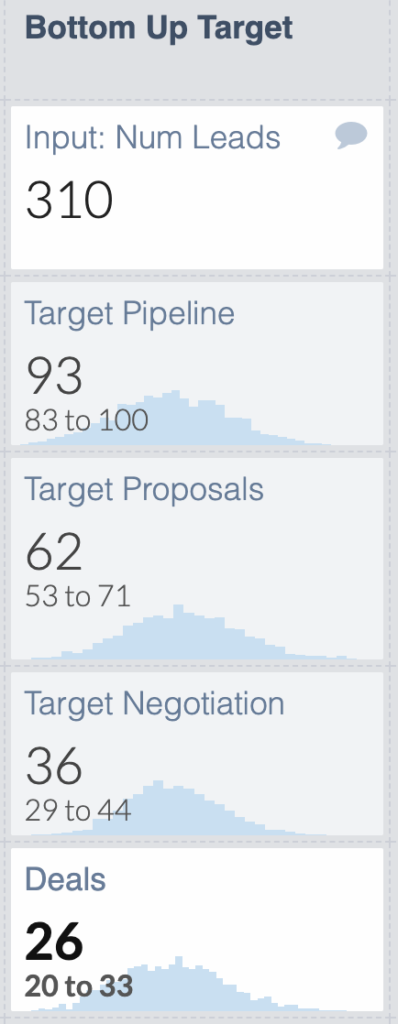
If we pick that as our new target, we can rest easy knowing that our target will be met, and we’ll probably end up getting more deals than we planned for. In fact, by flipping our formula and calculating the “target deals” given our conversion rates, we can derive that with 310 leads, there’s a 90% chance we’ll end up with 20-33 deals with a likely outcome of 26 deals.
Conclusion
The conversion rates you measure using standard reporting practices give you point estimates, whereas the underlying conversion rates of your processes are anything but certain.
When using conversion rates to extrapolate the number of inputs required to meet the target outputs of your process, you need to take into account your uncertainty to get a more realistic picture of potential outcomes.
By using the Beta distribution and Monte Carlo simulations, you have the tools to make approximately correct decisions every time, whereas using point estimates you likely be precisely wrong.
If you’re interested in getting your hands dirty with the demonstrated examples in this post, feel free to open the Guesstimate model I made and play around with the values.