In the previous post, I wrote about how you can measure the quality of your data assets. I also alluded that you should prioritize your measurement efforts based on the value the data bring to your business since the act of measurement itself has a cost associated with it that may exceed the benefit that information provides. In this post, I’ll be going over how you can actually quantify the value of data, and ways to apply it to your information strategy to drive meaningful results.
Most companies have an obsession with measuring OKRs, KPIs, and business metrics. The mantra “Data is the new oil” has been used as an excuse to hoard more and more data from every source imaginable. Unfortunately, data by itself is worthless unless we can derive information from it that guides us towards better decisions, and ultimately, better outcomes.
We can quantify the capacity of our data assets to derive benefit for our business by measuring the value of information contained in those assets.
You can use this information to answer questions like:
- If acquiring information has a measurable expense, shouldn’t we be recouping that expense at a minimum?
- What is the market value of our data, and how can we realize this value?
- In our returns model, which measurements matter and which don’t?
- How much is my business worth given our information assets?
- How much is additional research does it make sense to do before making a business decision?
- Which data assets do I need to take better care of, and which ones can I discard?
Often these questions get ignored because we imagine that information is an “intangible” asset. However, regardless of what GAAP and IFRS regulations prescribe, your information assets have a tangible value that any experienced investor pays a premium for. In M&A situations, valuable information assets are often rewarded by potential suitors even though they are not auditable per accounting regulations, and nearly half of equity analysts take a company’s information and analytics capability into account when determining valuations.
How can a Chief Financial Officer align budgets without knowing the contribution of information assets to business performance, valuation, and M&A outcomes? How can a Chief Information Officer define an information strategy that does not take into account the value of that information?
We will now explore a framework for determining the value and business impact of information assets and identify ways to prioritize where information management efforts should be focused. The methods presented here are directly from the wonderful research done by Doug Laney and showcase the wealth of knowledge available in Chapter 11 of his book titled “Infonomics.”
Valuation Models for Information
There are two main reasons you may want to measure the value of information. If you are interested in optimizing your information management practices, you may track the foundational measure of information value. If, on the other hand, you want to understand the financial impact of information on your business, you can leverage the financial measures of information value.
Although these metrics have been logically separated into two classes, they can and should be used in tandem to pinpoint and close any gaps that may exist between realized and potential value and monitor changes to information value over time.
Foundational Measures of Information Value
The following measures may be appropriate for organizations that are not yet ready to attribute monetary value to their information assets or are experiencing difficulty scaling financial measures. They can be useful nonetheless as an index to help improve data quality and information management efforts.
Some of these metrics below build upon definitions described in my previous post about data quality which also explains how you can measure them in practice.
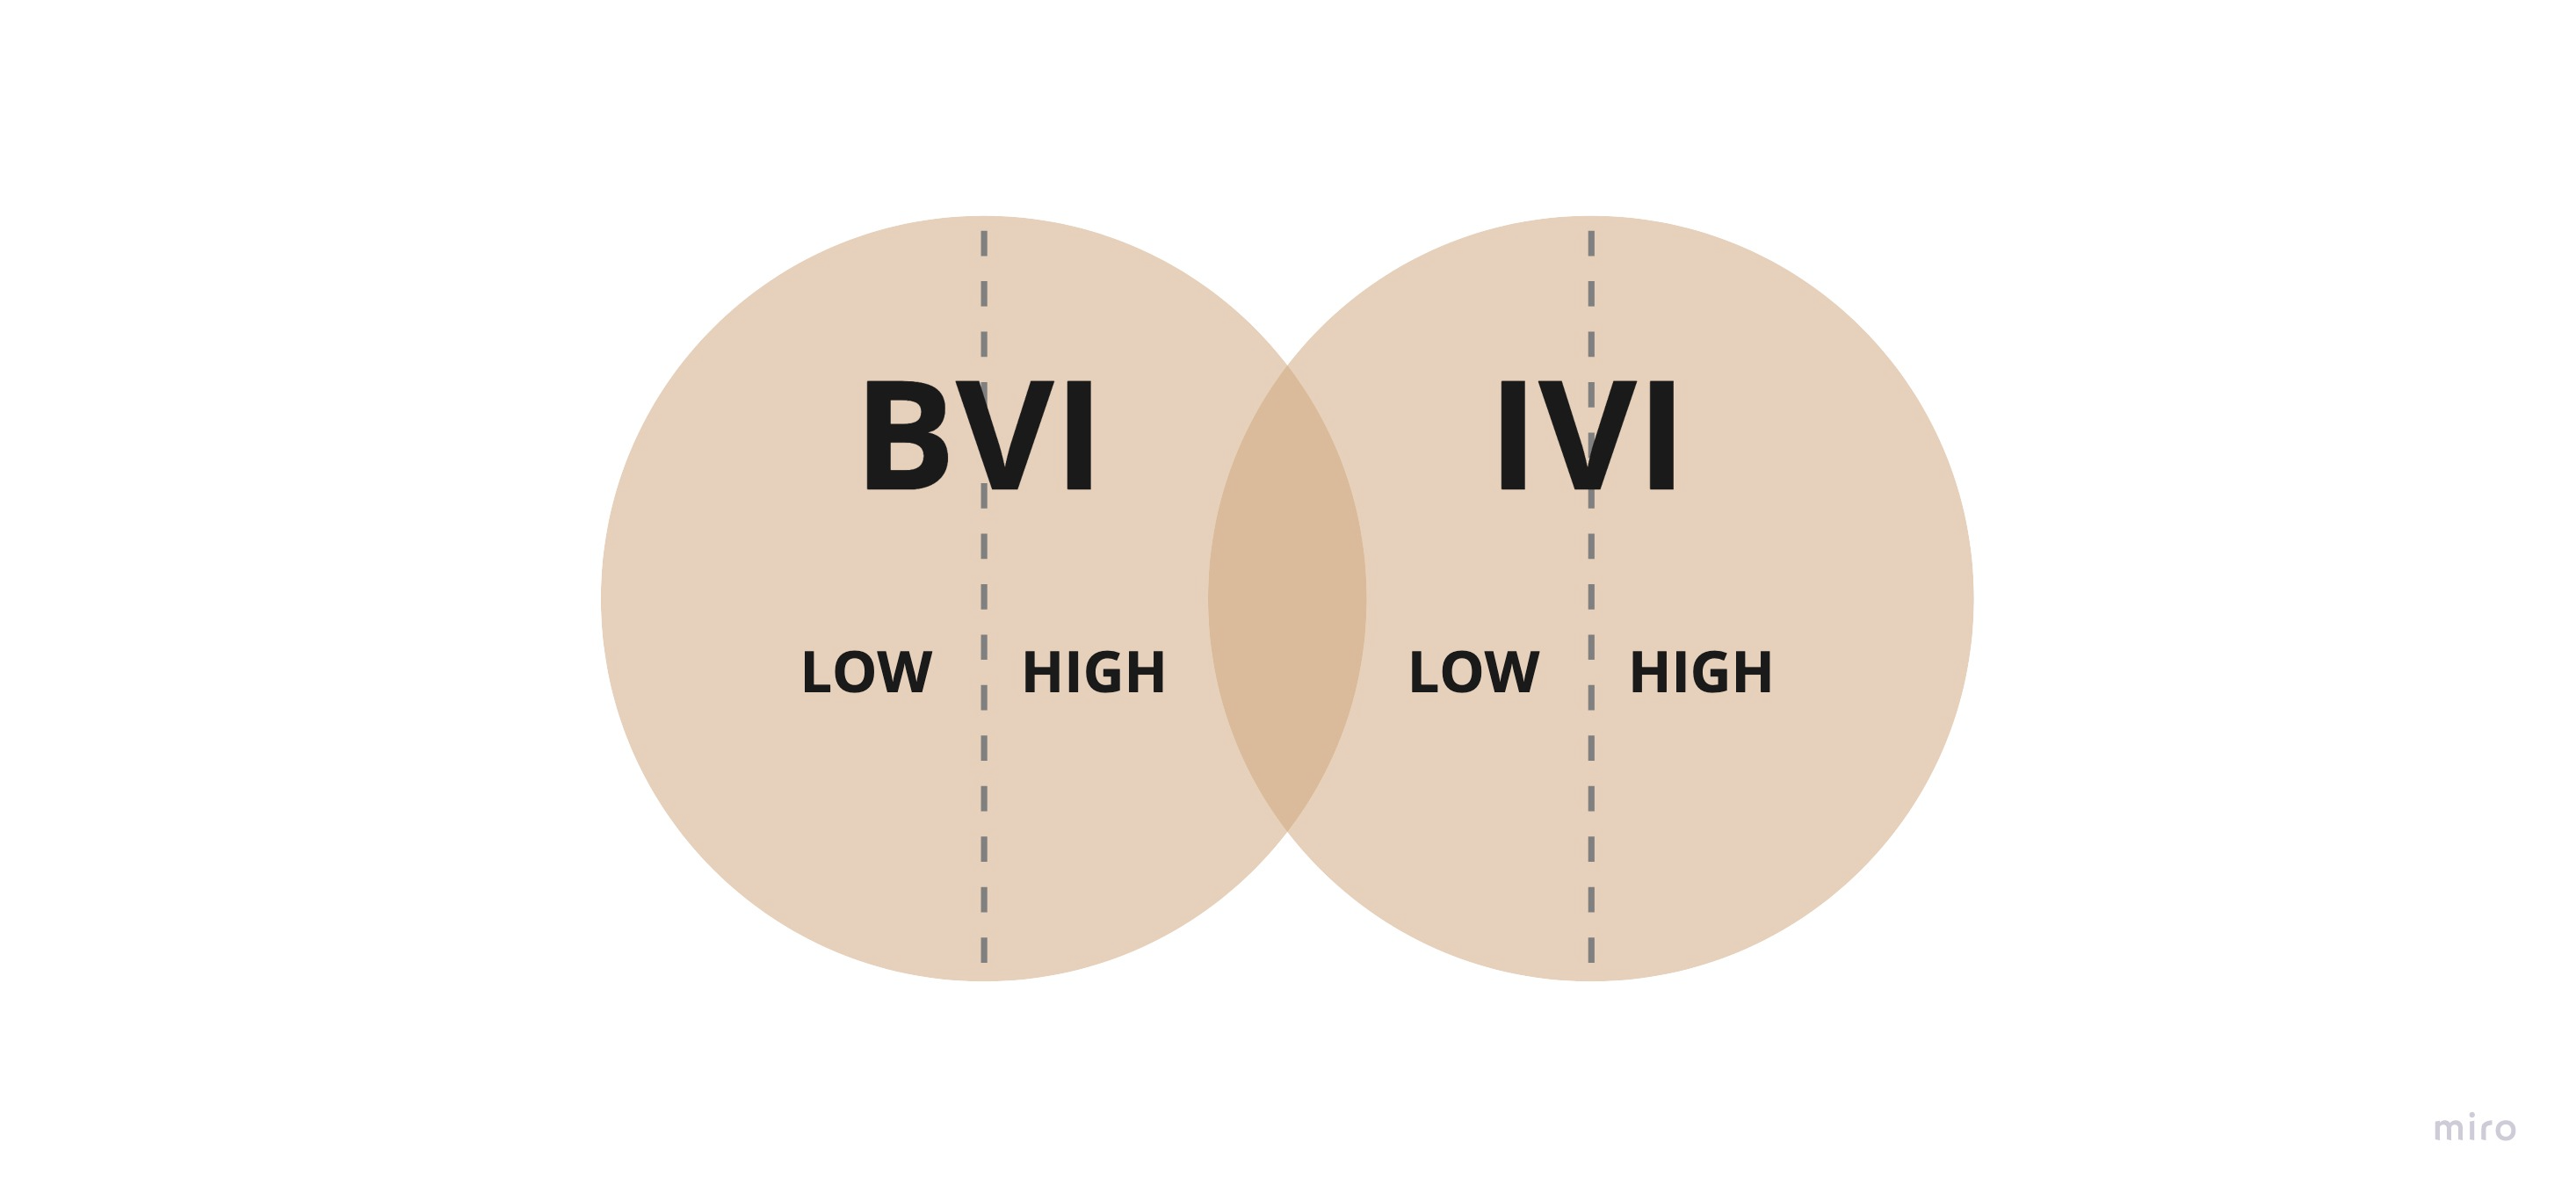
Intrinsic Value of Information (IVI)
The IVI allows you to evaluate the innate quality of data assets. This method describes how complete and accurate your information is and how likely it is that other organizations have this data.

- Validity: The percent of records with correct values
- Scarcity: An estimate of the percent of other organizations who don’t have this data.
- Coverage: The number of records in the dataset as a percentage of the total universe of potential records
- Useful Life: The number of periods (months, for example) that each record can reasonably be used or is relevant
How to use IVI
IVI can be used as a basic tool to compare the potential utility of multiple sources of similar information. Information with a high IVI is a good candidate to be made highly available in the organization, and information with a low IVI can be the target of data quality improvement efforts, or it may be discarded entirely if the cost of managing and securing that information is unjustified.
IVI is the easiest metric to calculate with a bit of automation and a crude understanding of the market, however, the IVI metric doesn’t take the applicability of the data to business activities into account.
Business Value of Information (BVI)
Unlike the IVI, the BVI recognizes the relevance of the information to business activities, as well as the quality and timeliness of that information. It can be used as a quick-and-dirty way to measure the potential real-world benefit information assets provide.

- Relevance(p) — The potential usefulness (0 to 1) of the information to the business process p
- Validity — The percent of records with correct values
- Coverage — The number of records in the dataset as a percentage of the total universe of potential records
- Timeliness — The probability that at any time, the information is current (matches real-world facts). This is a more easily measured version of the time-lag between real-world events and the appearance of those events in a dataset.
When to use BVI
The BVI requires that you enumerate the business processes that can benefit from the data and ascribe a “relevance score” of the information to each business process.
By contrasting the processes already using this information against the processes that have yet to benefit from this data, you can quickly identify opportunities for extraction of value from existing information assets. Furthermore, you can make a case for seizing investments or disposing of information with a low BVI.
The downside of BVI is that in order to identify the relevance to various business processes, you may have to involve many people from across the organization. Lastly, the relevance metric is highly subjective which may prolong the analysis process.
Performance Value of Information (PVI)
The PVI approach defines the value of information by its impact on improving some business performance driver, as measured by a Key Performance Indicator (KPI). Some examples of potential KPIs are “Conversion Rate” or “Order Fulfillment Time.”
IVI and BVI are leading indicatorsof business value, whereas this measure is a lagging indicatorbecause we have to run a controlled experiment to determine the impact of the information on KPIs.

- KPI(i) — The KPI for the business process with the information
- KPI(c) — The KPI for the business process without the information (control group)
- T — The usable life of any datum
- t — The time over which the KPI was measured
The KPI ratio provides a measure for the lift in KPI when using this information asset and the time ratio projects the lift over the useful life of the data.
A positive PVI indicates a net benefit for the process, whereas a negative PVI detracts from the KPI.
How to use PVI
PVI provides an excellent and objective proxy for monetary outcomes without the need to introduce a process-level analysis or estimation of potential benefits.
The PVI requires running a standard A/B test, so it is important to keep all other factors constant between the informed and control groups.
Running controlled experiments does usually require changes to operating procedures and there may be an additional cost associated with incorporating the information we’re evaluating into the process.
On the other hand, this method helps build a culture of scientific business experimentation and a framework for quantifying the benefits of information decisions.
Since PVI is a lagging indicator, it is less useful than the IVI and BVI for prioritizing information-related activities on the basis of unrealized information value.
Financial Measures of Information Value
Financial information valuation models are variants of valuation models used for traditional assets that adjust for the unique properties of information, such as its non-depletion, negligible cost to replicate, and licensability instead of transfer of ownership.
These economic models can be used to determine the monetary value of information in transactions as well as the amount you can spend acquiring, securing, or otherwise maintaining the asset.
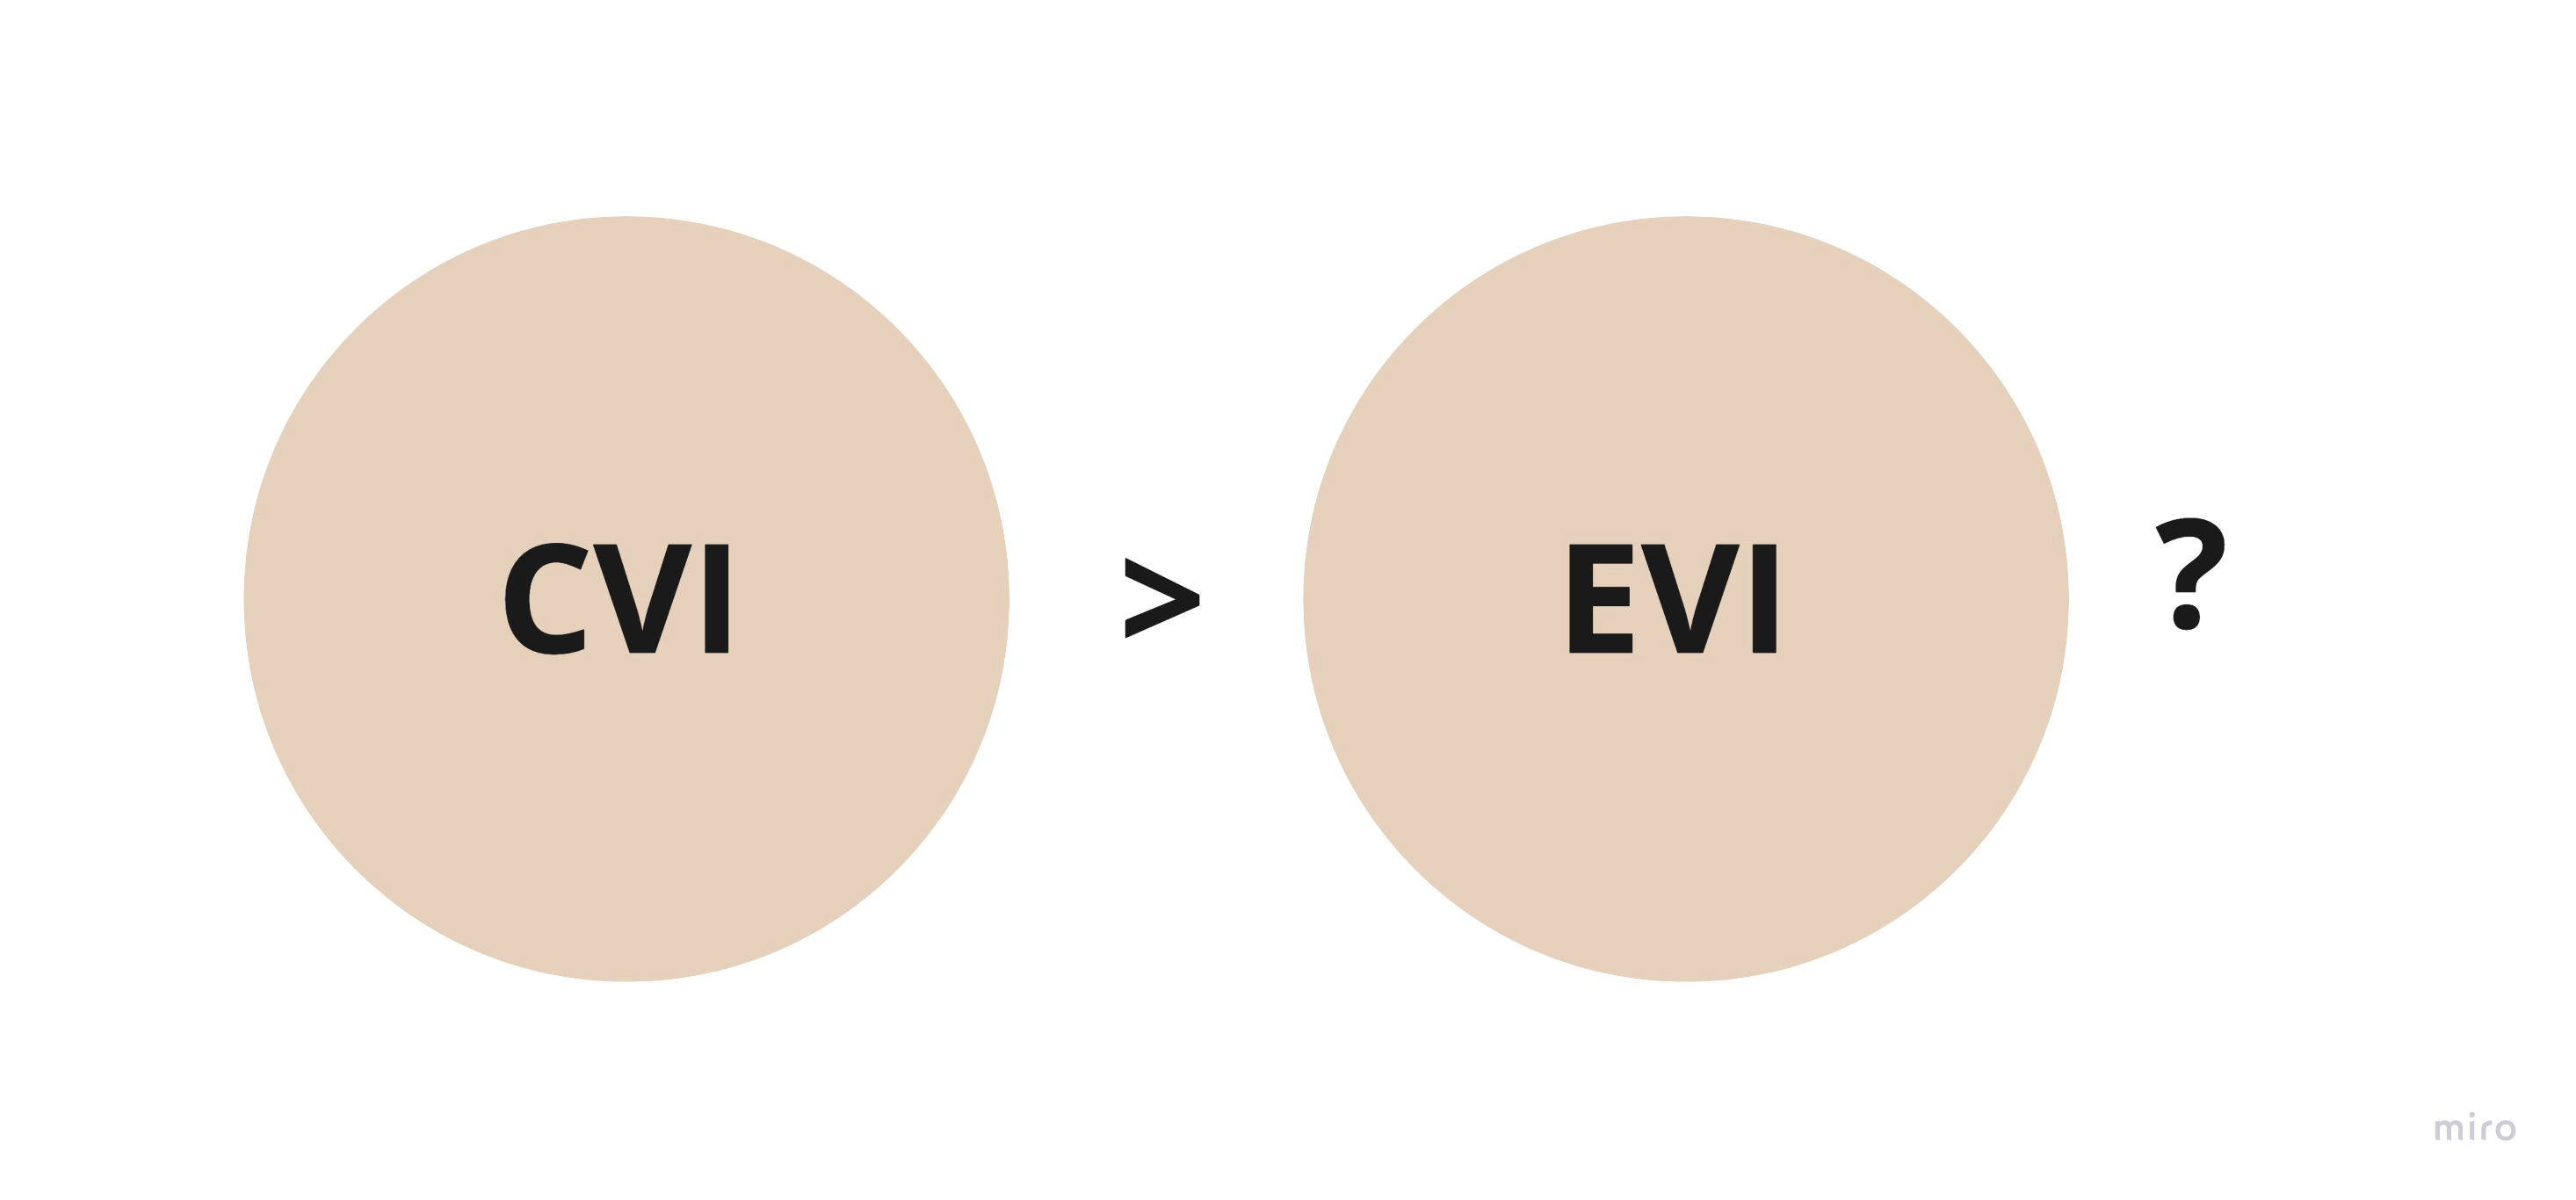
Cost Value of Information (CVI)
CVI assigns value to data by simply measuring the cost to collect and maintain them and, optionally, any lost revenue incurred if data were lost or damaged.
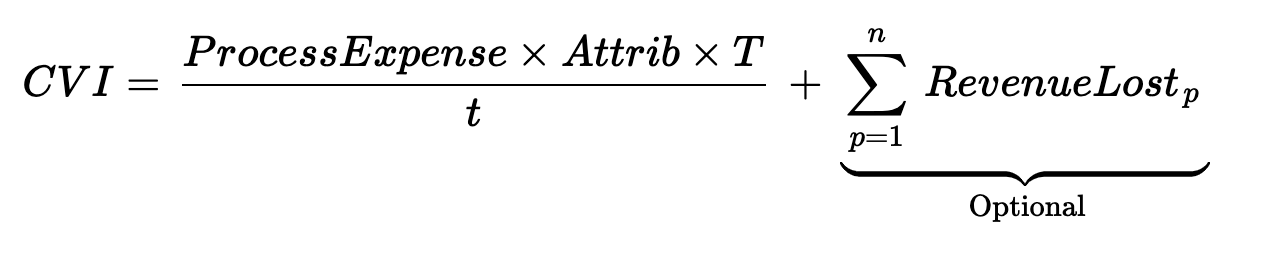
- ProcessExpense — AnnualizedCost of the processes involved in the path of data capture
- Attrib — The percent of the process cost specifically attributable to capturing the data
- T — The usable life of any datum
- t — The period over which the process expense was measured
- n — The number of periods until the business is no longer affected by the lost or damaged data or until the data is recovered
How to use CVI
The CVI is a conservative and less volatile approach to information valuation. It can be used when there is no obvious market for the data, although estimating the expenses attributable to data capture can be difficult and subjective.
It can also be used when it is prohibitively difficult to tie the data back to revenue, however, including lost revenue in the model can aid in quantifying the level of risk involved in a potential data breach or other type of data loss.
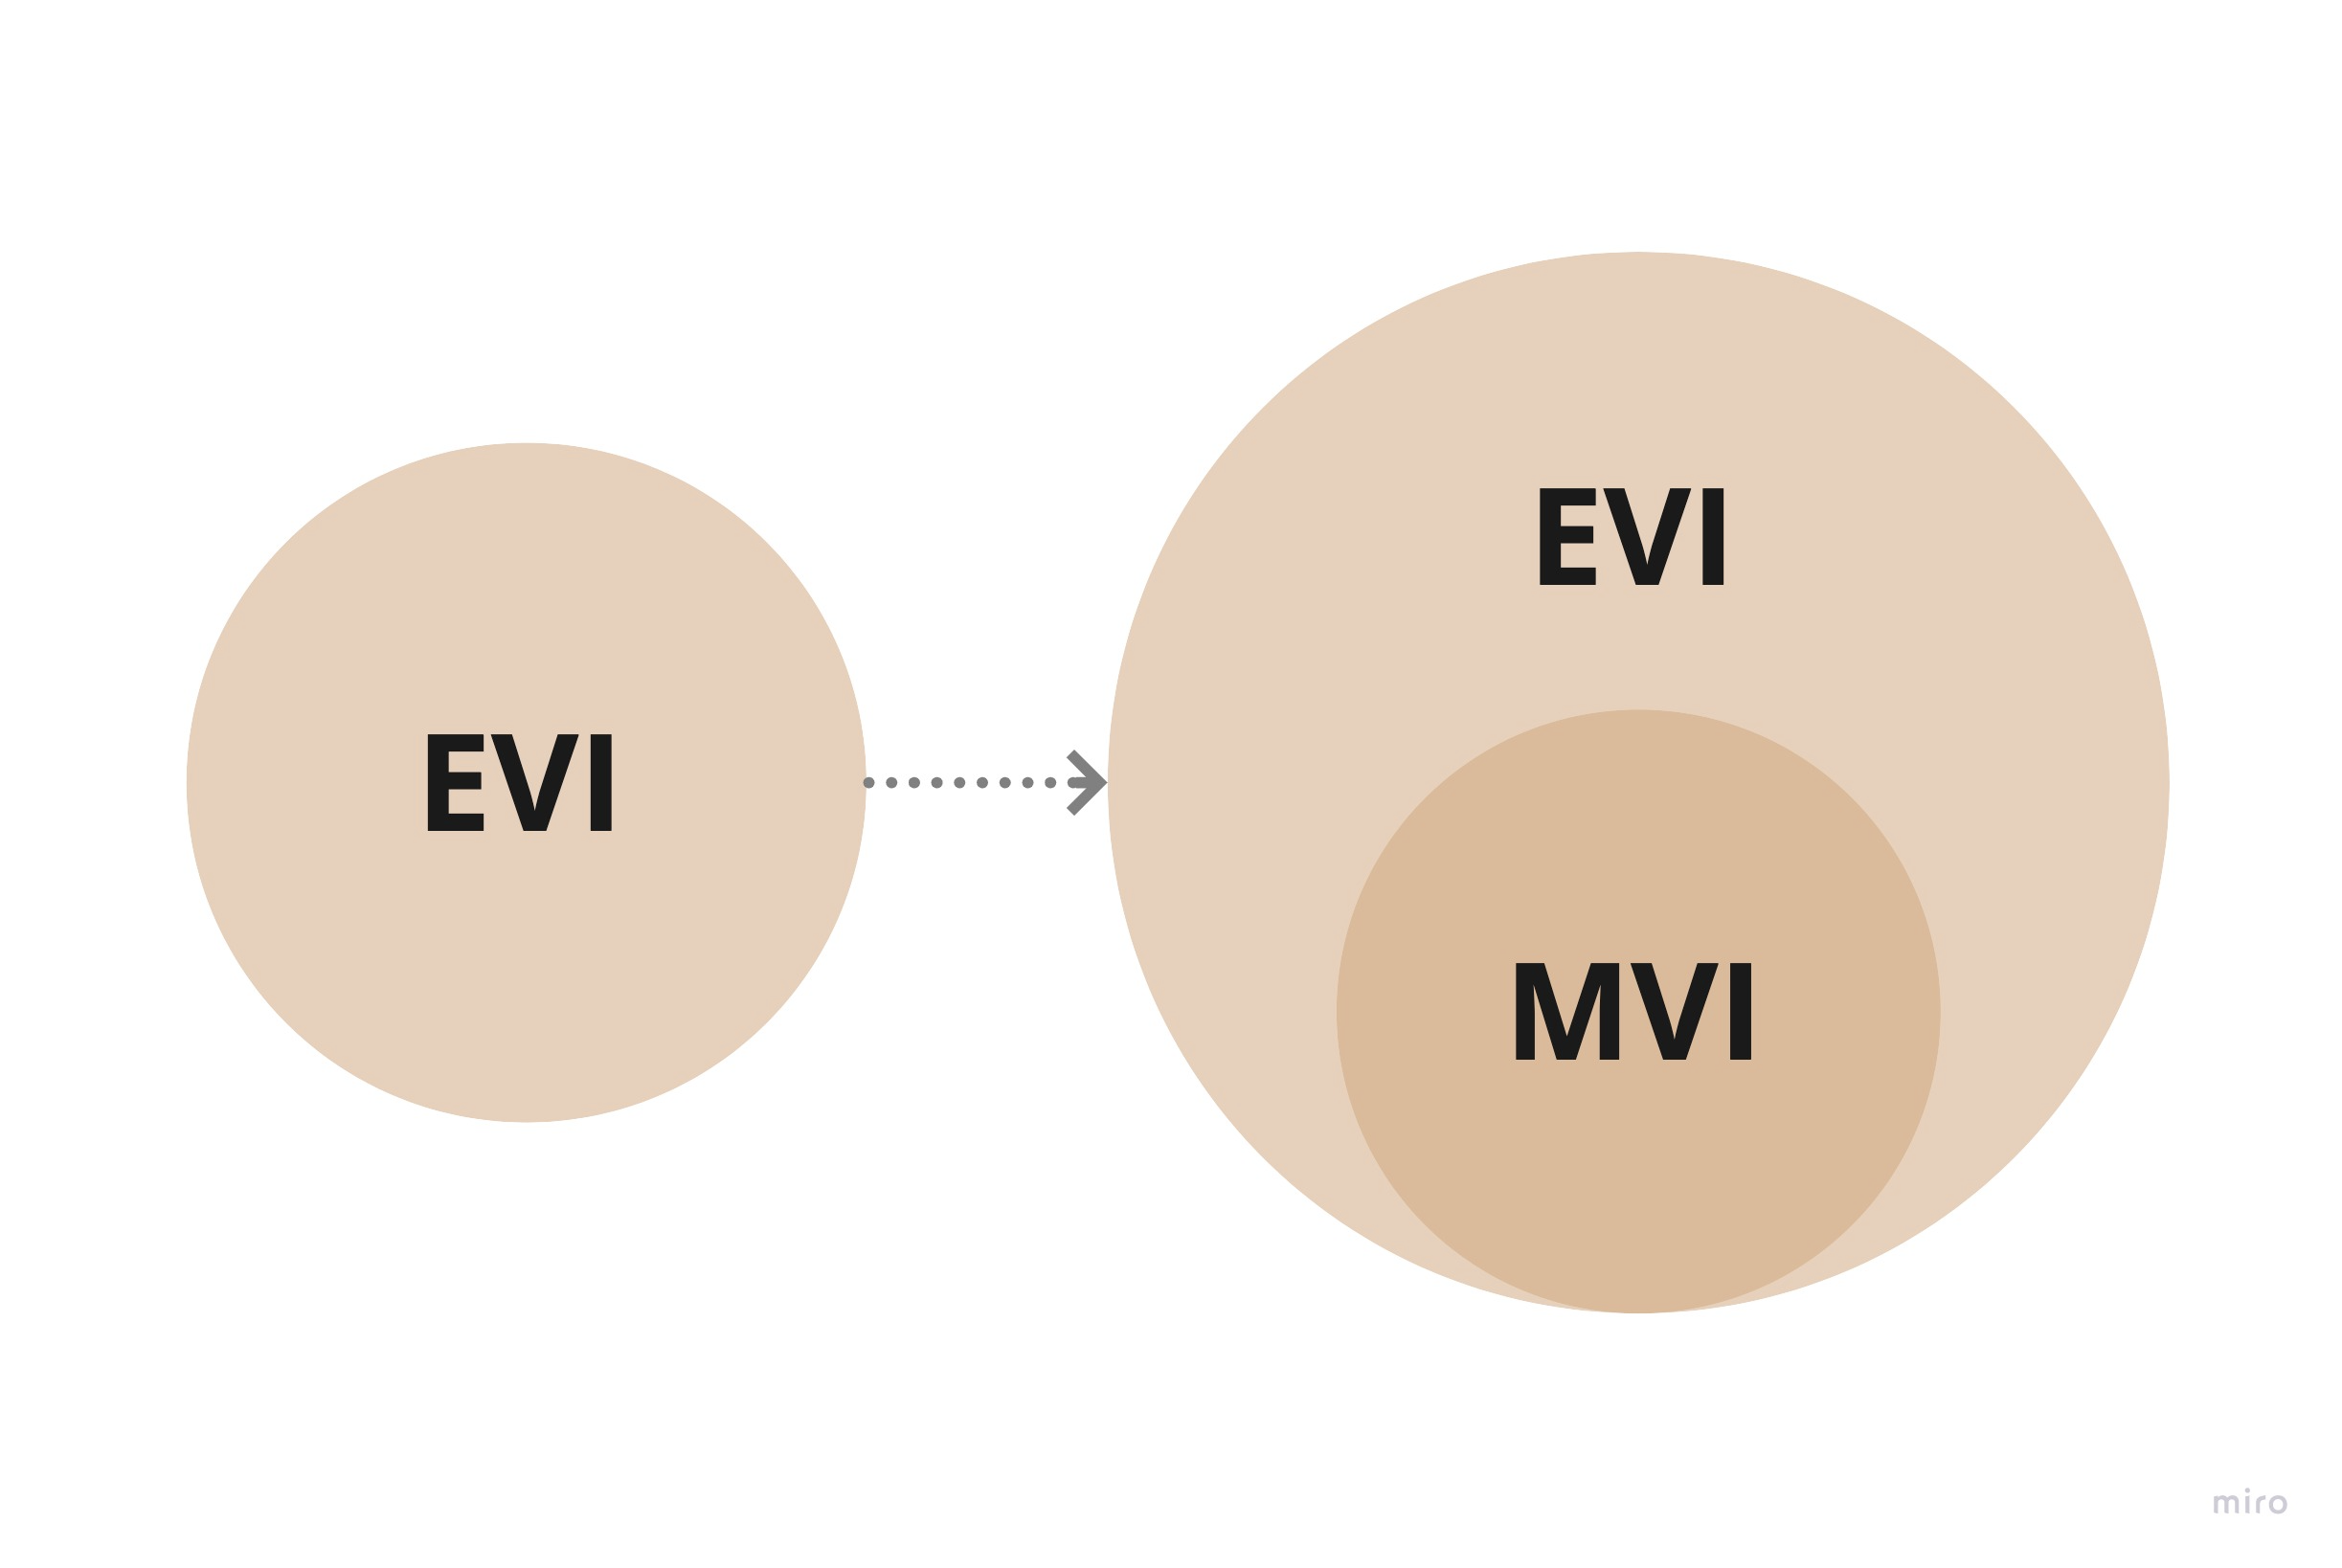
Economic Value of Information (EVI)
The EVI measures the attributable lift in revenue by applying the information to our business processes.
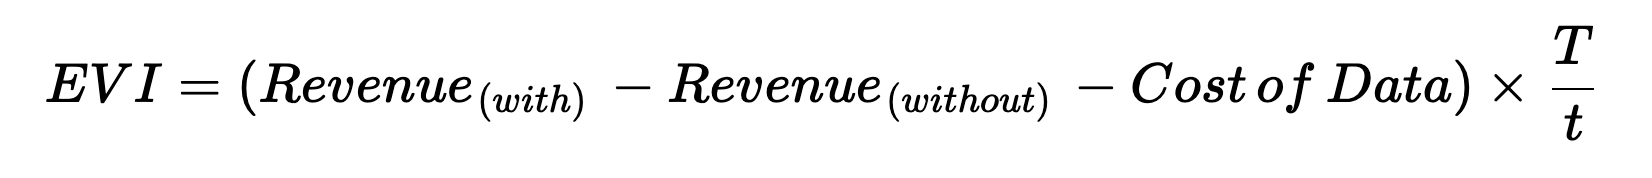
- Revenue(with) — Revenue generated with the data
- Revenue(without) — Revenue generated without the data
- Cost of Data — The cost to acquire, administer, and operationalize the data in relevant business processes
- T — The usable life of any datum
- t — The period over which the experiment was executed
How to use EVI
Since EVI deals directly with revenue, it is a very powerful and tangible measure of the value of data.
Similar to the PVI, you can use EVI as a lagging metric by running a controlled experiment and measure the actual lift in revenue obtained from using the data. Of course, this requires you already have the data and can apply it to your business processes at some expense.
If, however, you want to know whether you should invest in using the data to drive revenue, you can estimate Revenue(with)and instead use EVI as a leading metric.
To do this, you must identify the causal path to revenue and building a traditional ROI model. In other words, you can map out how value is being created in your business and identify how the addition of the data can increase revenue or save costs. Note that using EVI as a leading metric renders the formula term t extraneous.
Do keep in mind that rather than ignoring your uncertainty about your assumptions in your ROI model, you can include them in your model by specifying them as ranges and running a Monte Carlo simulation to determine the range of potential EVI.
Market Value of Information (MVI)
It is becoming increasingly more commonplace to see data monetized as a line of revenue. Data can be licensed directly or on data marketplaces, and it can be bartered or used to negotiate favourable terms. In these scenarios, the MVI is the ideal measure of data value.
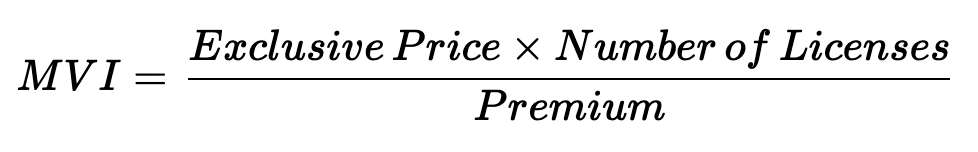
- Exclusive Price — The hypothetical price a customer would pay to get exclusive access to the data
- Number of Licenses — The number of potential parties that would license this data for the useful life of the data
- Premium — The multiple over any given licensing fee an interested party would pay for exclusive access to the data
How to use MVI
The MVI can be used to determine acceptable licensing costs or tradable value of information products. The MVI accounts for the fact that the ubiquity of the data asset leads to a decrease in overall value. This is expressed as the inverse premium term, which can be determined through surveys.
The EVI or CVI measures can be used as the basis for the exclusive price.
In order to derive the number of potential licensees, you can use traditional top-down or bottom-up market sizing methods.
The MVI is not particularly useful in determining the value of non-marketable information assets and getting the input assumptions can be tricky and lead to wildly different valuations if not determined carefully.
Expected Value of Perfect Information (EVPI)
Can you measure the value of the information you don’t have? That is exactly what EVPI can help you determine. In decision theory, EVPI is routinely used to calculate the theoretical maximum one should pay for information leading to the correct decision with the maximum payoff. Having perfect information would mean that the wrong decision can be avoided.

How to use EVPI
The act of measurement (gathering more information) reduces your uncertainty about the outcome of a monetary decision, such as the ROI on some investment. The EVPI sets an upper bound over how much that information is worth, up to break-even, given your current level of uncertainty.
Since most business decisions are ultimately monetary decisions, you can allocate a small percent of the EVPI (e.g. 10%) towards the collection of information that could potentially yield a better expected payoff.
A disadvantage of using the EVPI is that it requires you to model how value is generated in your business and that can be time-consuming and fraught with measurement challenges and assumptions.
However, once you have this model, it can be reused to estimate Revenue(with) and generate a leading EVI (Economic Value of Information) measure.
Generating this model provides another powerful advantage as well. By incorporating other decision theory concepts like the Expected Value of Sample Information, you can quantify the contribution of each variable in your model towards the economic benefits.
If this all seems too abstract for your liking, I highly recommend that you watch this short and friendly introduction to decision analysis to better see how these concepts can be applied.
Combining Information Valuation Models
The individual valuation models are useful by themselves, and each model excels at looking at value through a particular lens. By combining the strength of each model, we can identify and close information value gaps.
Prioritize Information Management Investments
You can use IVI (or a variant using the other quality measures mentioned in my previous post) to identify information assets with low intrinsic value and high potential business relevance and prioritize data quality improvement efforts on those assets.
Identify New Revenue Opportunities
By assessing the MVI of information you’re utilizing internally, you may find opportunities for external monetization in the form of new information products, discounts, or bartered goods. In M&A scenarios, knowing the MVI of your internal data can also open doors to information-savvy buyers who would gladly pay a premium for your valuable data assets.
Defensible Disposal of Information
You can use the CVI and EVI to make a strong case for disposing of information that costs more to manage than the value it provides.
Accelerate Innovation and Digital Transformation

Your business can ideate ways to extract more economic value from that data with high business relevance but unrealized economic potential. Often, this can act as a driving force behind digital transformation initiatives.
Validate the Benefits of Information Governance

By tracking the increase in KPIs through the improvement of data quality, you can demonstrate the effectiveness of information governance practices. For example, you can link better data documentation to an increased usage of your data lake.
Determine the Marketability of Information Assets
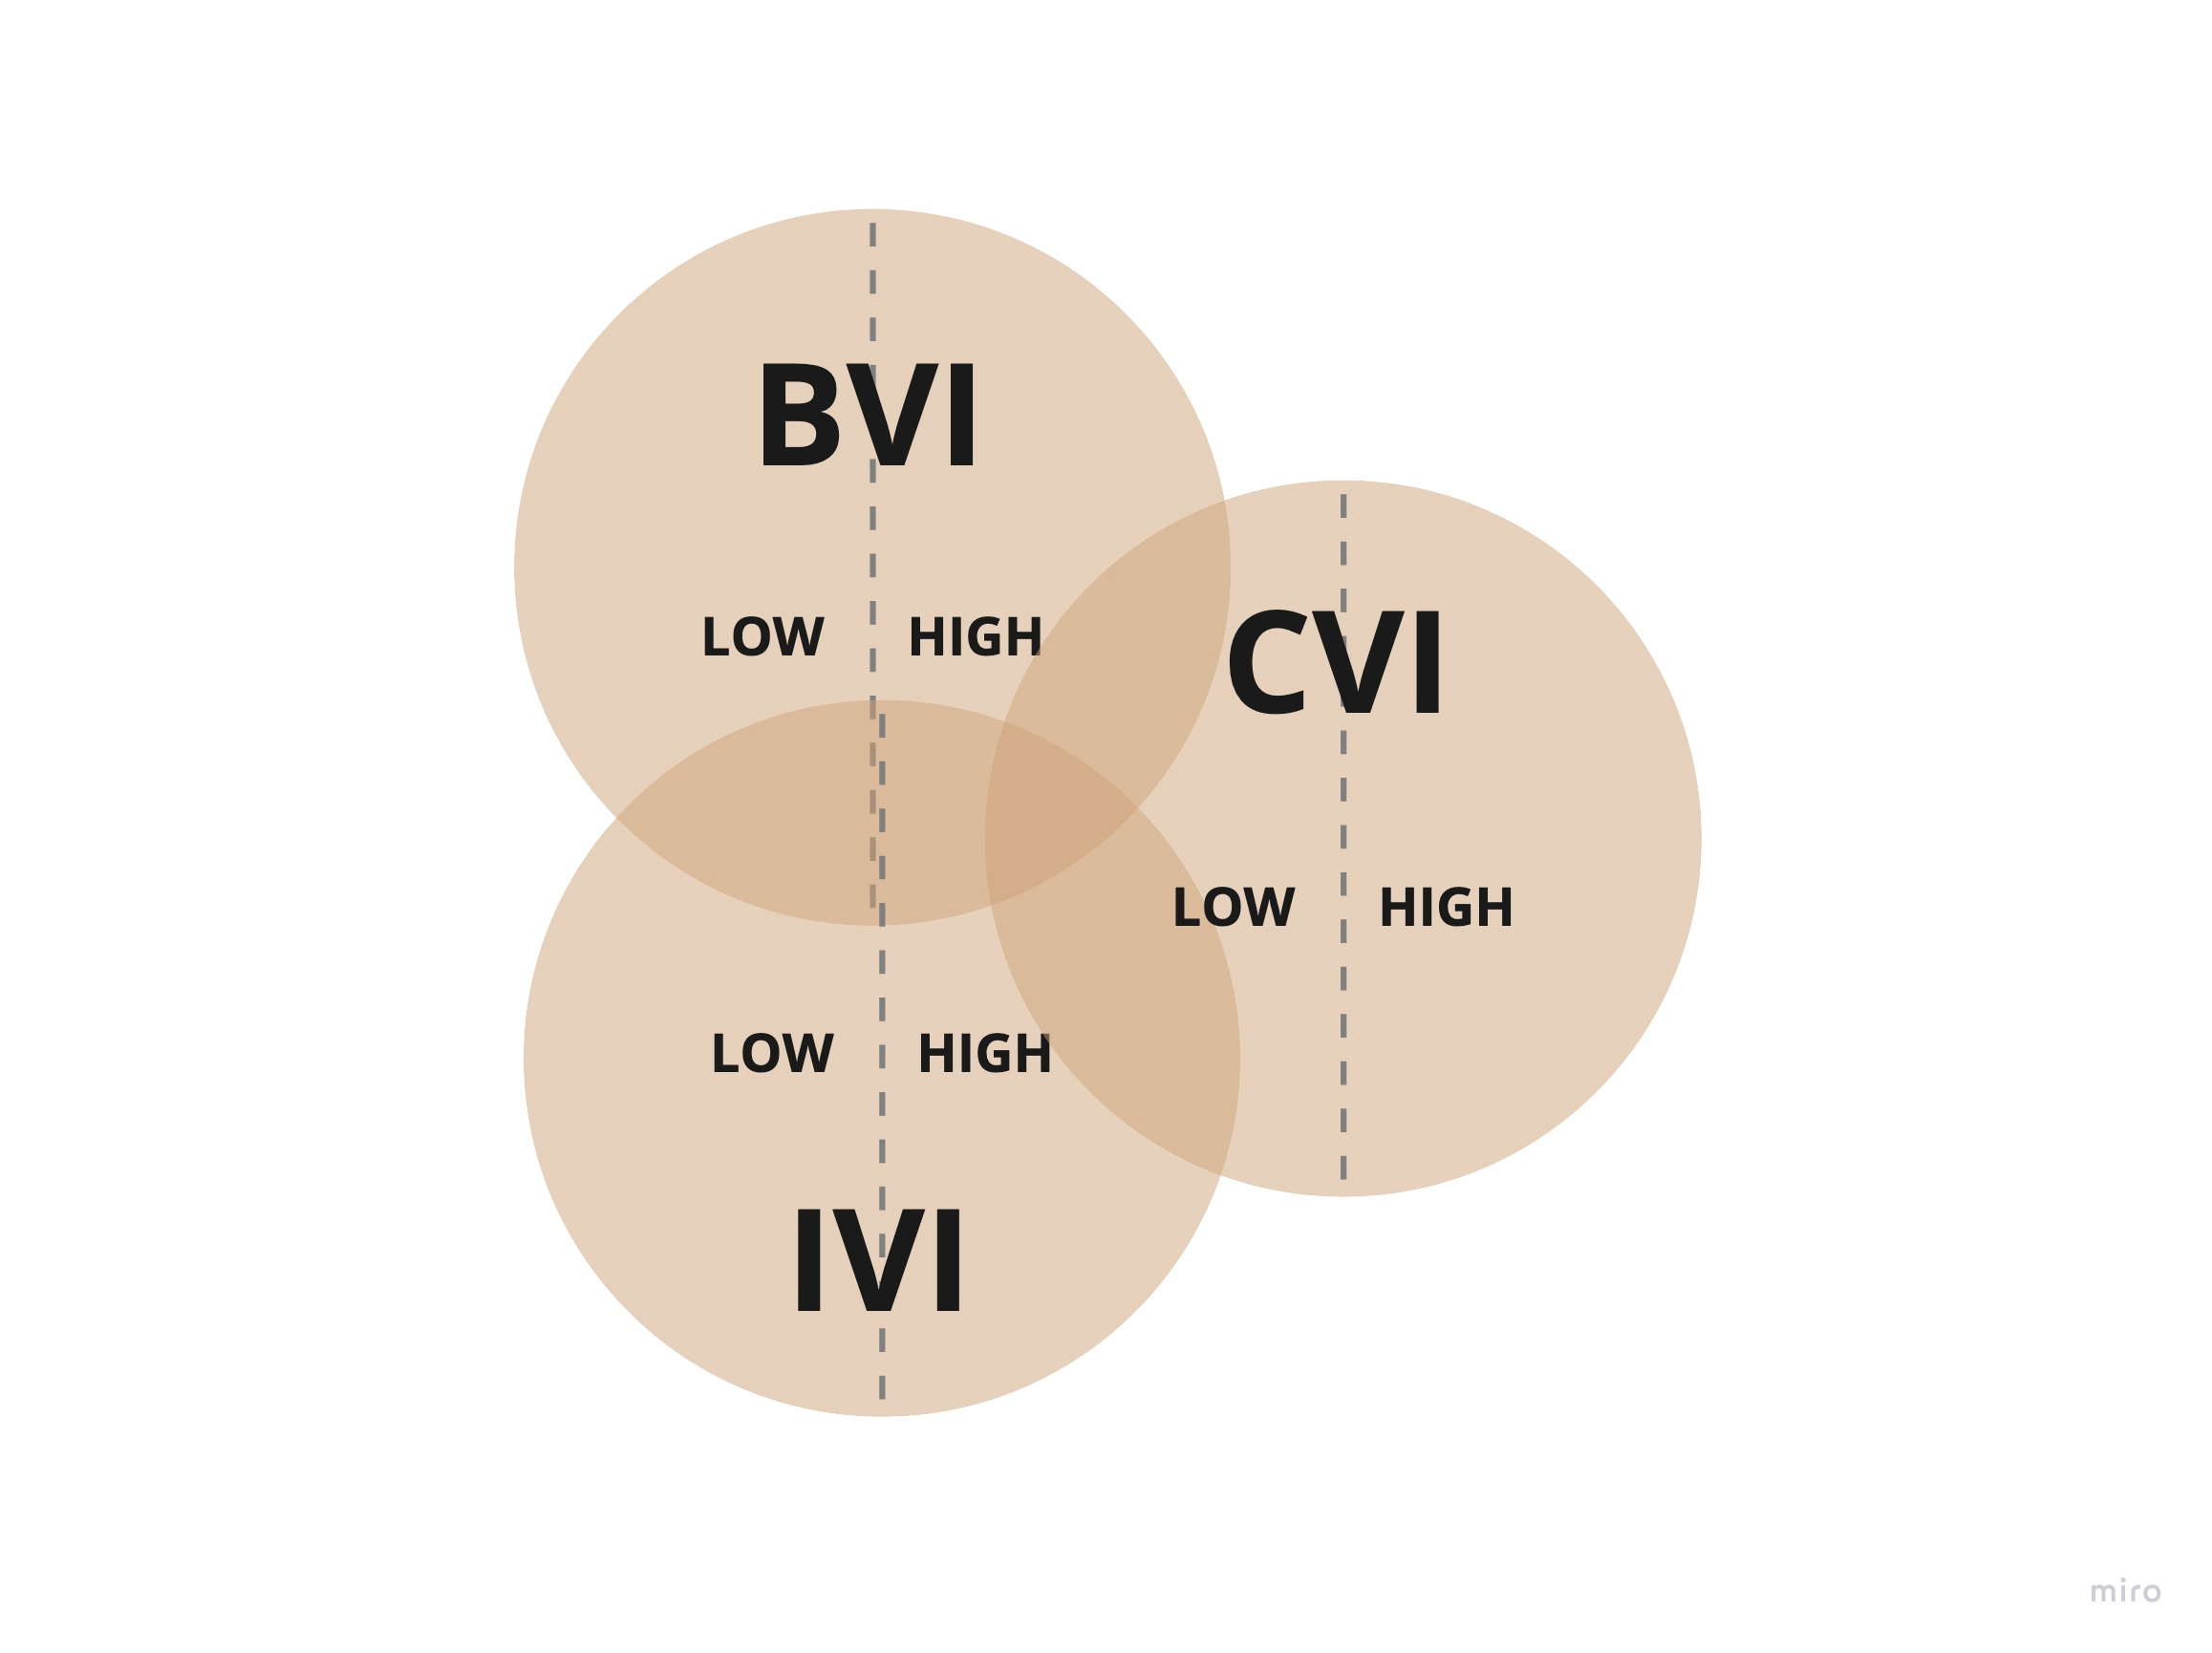
Sometimes, MVI alone is not enough to determine the marketability of information assets because it fails to take into account the quality and cost of managing the asset. You can combine IVI, external BVI, and CVI to identify marketable assets and take these variables into consideration.
Conclusion
You now have a spectrum of tools at your disposal to understand and act on the value of your information to enhance the value of your business.
However, the buck does not stop with these formulas. You can be creative with how you apply and combine these methods. The most important thing is the shift in mindset from “intangible” to “tangible” value.
While it may be tempting to take a nearby dataset and start applying these techniques, it would be much more effective to apply your data valuation efforts to one class of related information at a time, such as customer or product data.
Even though a one-time analysis of value is certainly useful, you may not find that as meaningful as finding gaps between realized and unrealized value, tracking the improvement or deterioration of value over time, or combining metrics to guide your data strategy.
Further Reading
If you found this topic interesting, you’ll be happy to know that the bulk of these ideas came from an online course at the University of Illinois taught by Doug Laney as a part of the Infonomics Specialization. Doug is a former Vice President and Distinguished Analyst with the Gartner Chief Data Officer (CDO) Research and Advisory team and has published a book diving deep into the topic of information valuation and monetization.
This is not the only way to measure the value of information and you will find many interesting alternatives proposed by other researchers and practitioners:
- Douglas Hubbard, “How to Measure Anything” focuses on the economic value of information for decision-making.
- Paul Strassman, “The Value Of Computers, Information and Knowledge”
- Tonie Leatherberry’s and Rena Mears, “Data as an Asset: Balancing the Data Ecosystem”
- Mark Albala, “Recognition of Information Value”

2 Responses
First of all great article :), secondly from my experience one of the main issues is convincing managers and stakeholders that protecting the data from an cybersecurity point of view is the main obstacle, because the stakeholders usually cannot perceive a cost of losing data because they never actually calculate the price of acquiring the data. One example that comes to my mind is an acquisition of a customer for opening a bank account. I assume all the costs of man hours in marketing, cost of marketing campaign, cost of call center conversation etc. has to bee taken in account. Can you provide an example of how you measure the data acquisition process?
Thanks for reading!
You’re on the right track! You’re referring to the CVI which is worth trying. For simplicity I’ll leave out the RevenueLost bit.
Recall that \(CVI = (ProcessExpense * Attrib) * T/t \)
Where:
– ProcessExpense is the annualized cost of the processes involved in the path of data capture2
– Attrib is the percent of the process cost specifically attributable to capturing the data3
– t is The period over which the process expense was measured (a year?)
– T is the useful life of the datum (Maybe the average lifetime of the customer?)
Using this method, you can estimate the cost of acquiring a customer for opening a bank account by adding up the expenses of marketing, call center, and other processes that are involved in capturing the customer data. You can also estimate the percentage of these expenses that are directly related to data capture, and the number of periods that the customer data is useful or relevant for the business. By multiplying these factors, you can get the CVI of the customer data.
The CVI can help you justify the investment in data acquisition and protection, as well as the potential loss of revenue if the data is compromised or destroyed1. However, the CVI is a conservative and less volatile approach that does not take into account the economic benefits or market value of the data. For that, you may need to use other methods such as the Economic Value of Information (EVI).
For the EVI, you’ll actually need most of the numbers from the CVI. An example might be the bank running a campaign to get 1,000 new customers.
Assume the 1,000 new customers generate an additional 200K in revenue in the first year due to the campaign (Revenue_with). Without the campaign, we estimated revenue would have been 50K (Revenue_without). The cost of the data, including the campaign and operational costs, is 100K (assumed Cost of Data a.k.a. CVI). If we expect the data (customer relationships) to be useful for 5 years (T), and we are looking at the first year’s revenue (t = 1), the EVI would be:
\(EVI = (\$200,000 – \$50,000 – \$100,000) \times \frac{5}{1}\)
\(= \$50,000 \times 5\)
\(= \$250,000\)
This calculation suggests that over the useful life of the data, the bank can expect an economic value of 250K from the campaign, reinforcing the value of protecting this data asset.
This is overly simplistic, but the idea is to look at the mechanics of how we’re doing these calculations and augment it to have more fidelity in your world, if needed.
In the context of cybersecurity, you also need to take into the probability of events in addition to the magnitude of loss. If you find this stuff interesting, I highly suggest you take a look at Doug Hubbard’s book “How to Measure Anything in Cybersecurity”