You need reliable information to make decisions about risk and business outcomes. Often this information is so valuable that you may seek to purchase it directly through 3rd party data providers to augment your internal data.
Yet, how often do you consider the impact of data quality on your decisions? Poor information can have detrimental effects on business decisions, and consequently, your business performance, innovation, and competitiveness. In fact, according to Gartner, 40% of all business initiatives fail to achieve their targeted benefits as a result of poor data quality.
Organizations that treat information as a corporate asset should engage in the same quality assessment discipline as with their traditional assets. This means monitoring and improving the quality and value of their information continuously.
In this post, we’re going to explore a practical framework for assessing and comparing data quality. This can be applied to data produced internally, as well as data purchased from 3rd party vendors.
Assessing data quality is a small but important component in measuring the overall value of information assets, which I’ve written about in a separate post.
Objective Data Quality Metrics
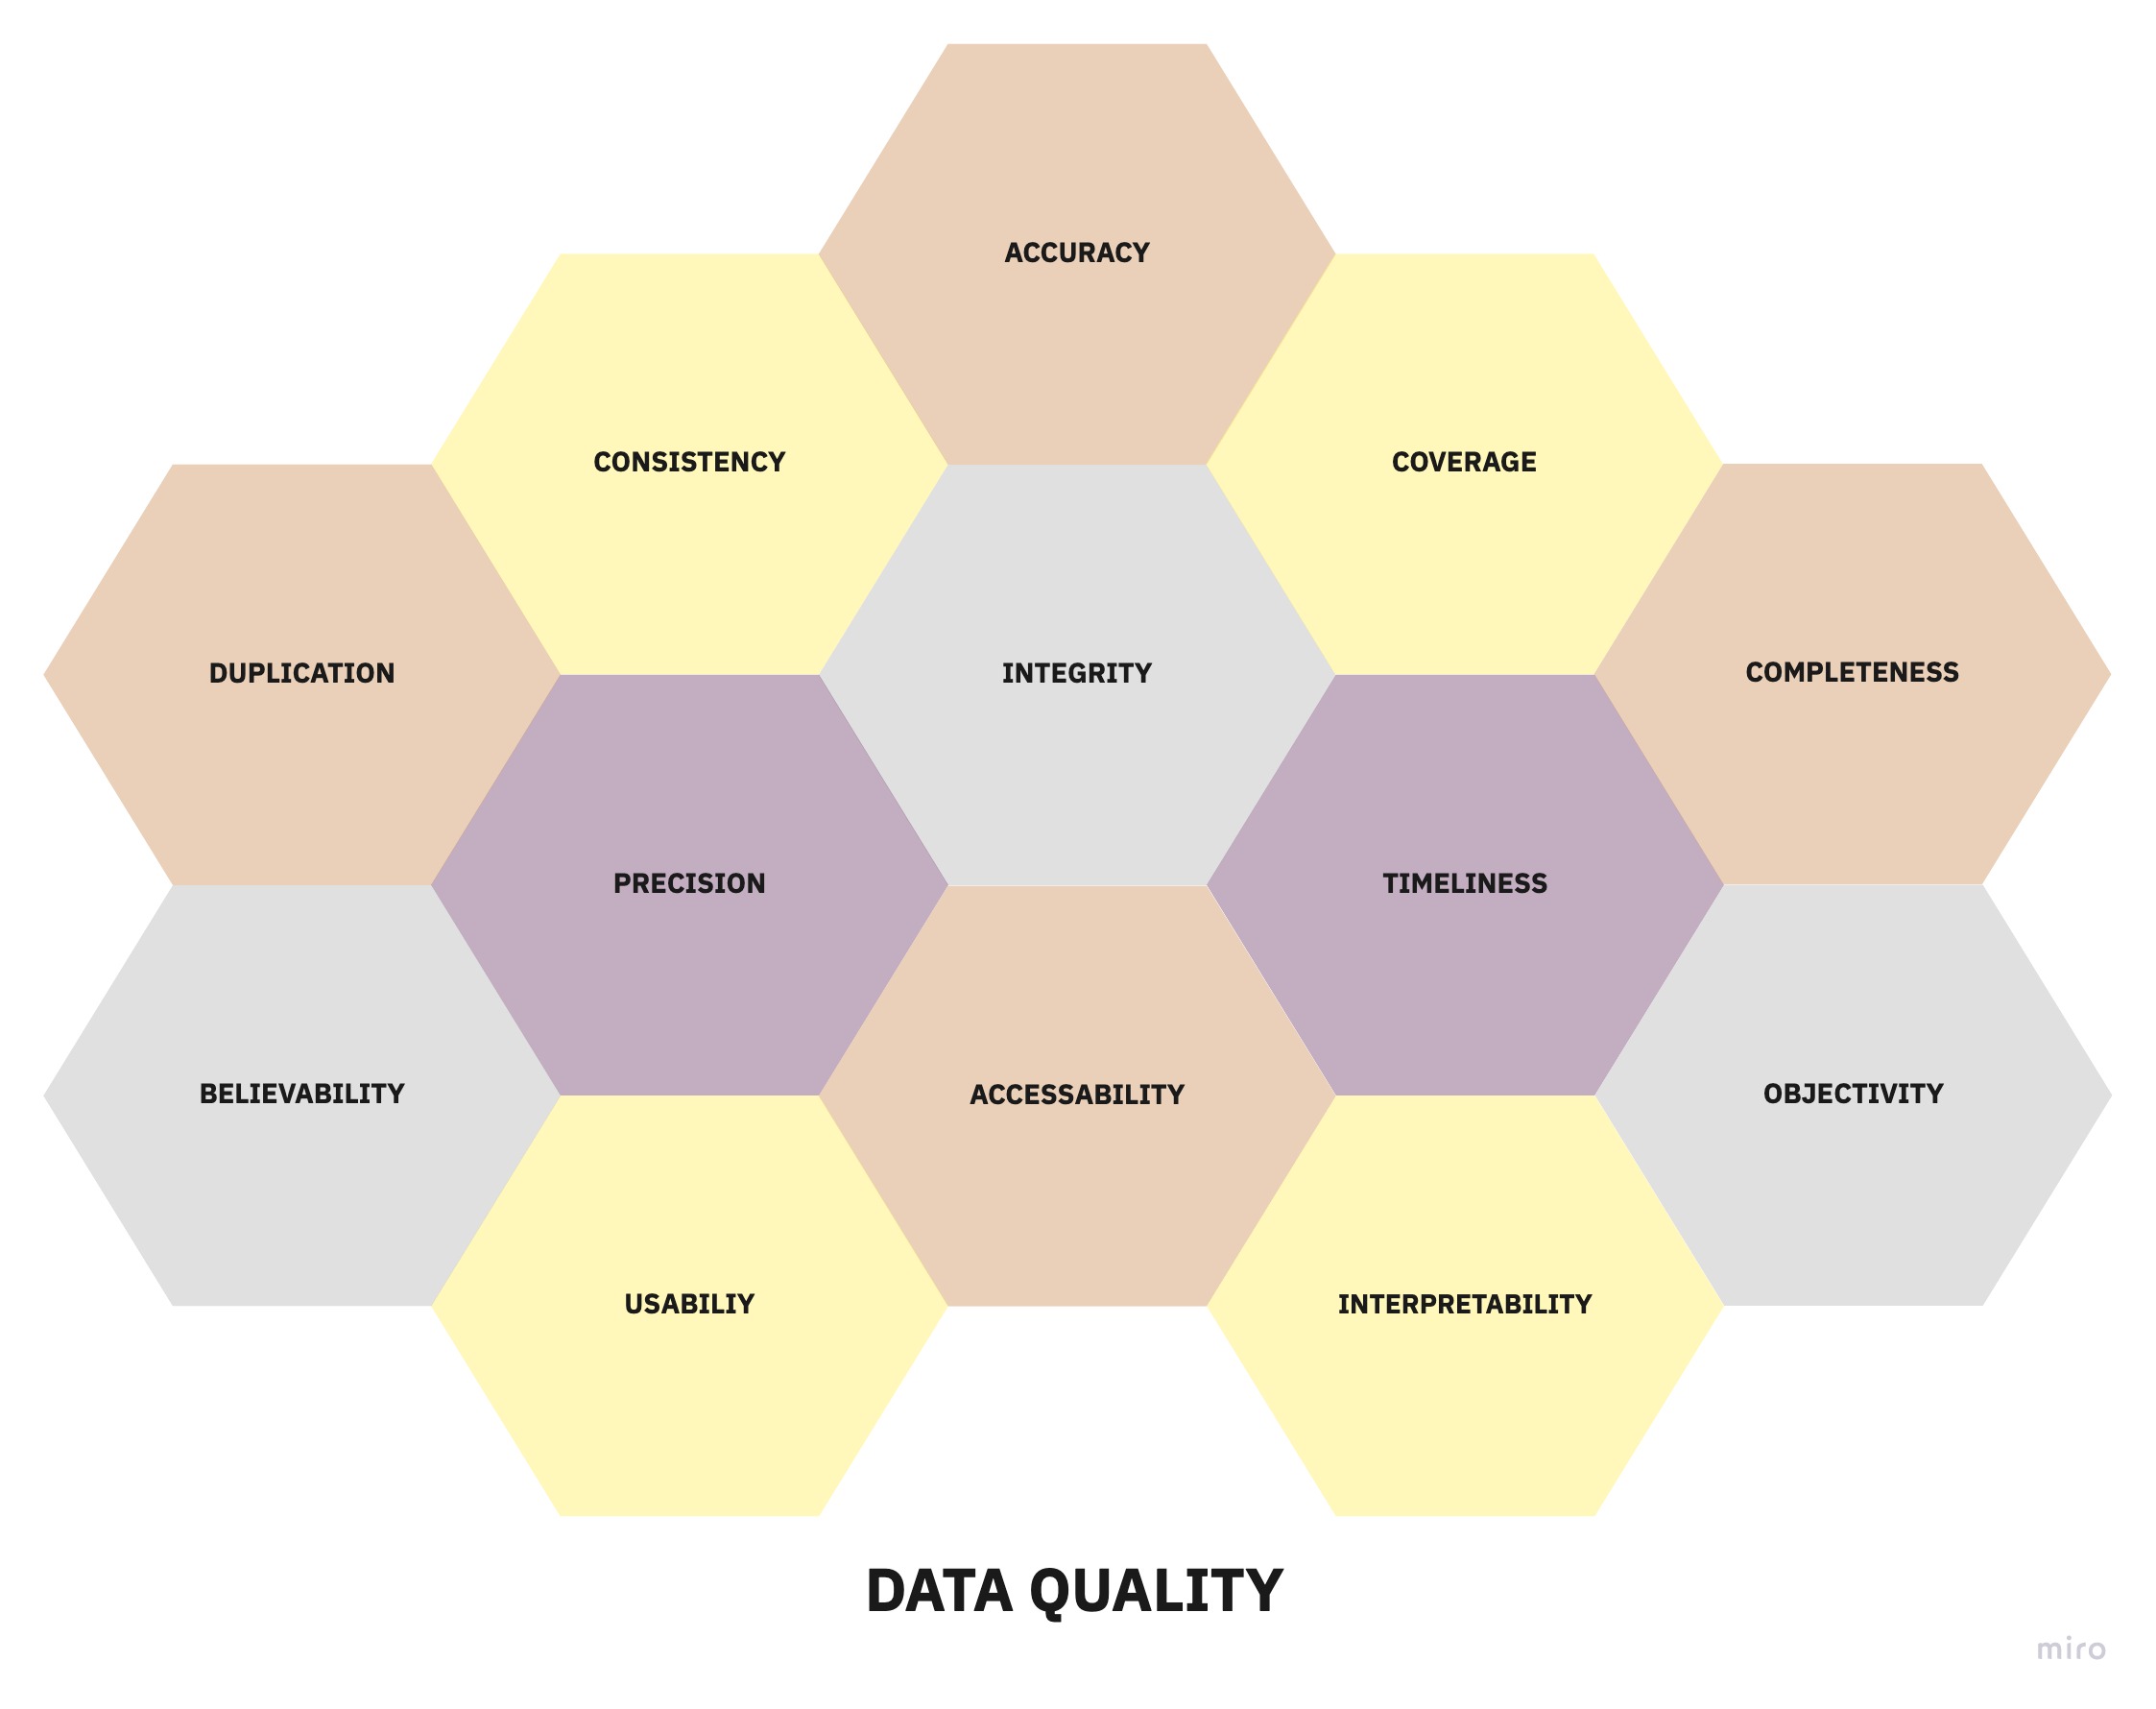
The most common data quality metrics can be broken down into the following categories:
- Accuracy – How accurately does each available data field represent reality? This is also commonly referred to as the validity of data.
- Coverage – What percentage of the events or objects of interest have records? For example, if you care about all companies in North America, what percent of North American companies are represented in the dataset?
- Completeness – Of all provided records, what percentage of the available fields have a value?
- Integrity – If there are relationships present in the data, how often are the expectations between related attributes violated? For example, the total funds raised by a company should always equal the sum of individual fundraising events for that company, or foreign keys should always point to records that exist (referential integrity).
- Consistency – How consistent is the data in format and structure within and across datasets?
- Duplication – What percentage of all records are duplicates?
- Precision – How exact is the data? What is the level of detail of unstructured data like text or images? What is the delivery frequency of the data provided?
- Timeliness – What is the probability that the data represent the values in the real world at any given time? Note that we’re not interested in the time lag between an event happening in the real-world and the event showing up in the dataset. In practice, this is extremely hard to verify and the business often cares more about the dataset being in sync with the source, rather than the time-lag itself.
- Accessibility – The number of business processes or personnel that can access and benefit from the data.
Subjective Data Quality Metrics
Not all aspects of data quality can be considered in isolation of their relationship with the data users. Some quality metrics are purely subjective but have a significant impact on the utilization of the data assets. These metrics are typically measured through user surveys.
- Believability – Do users trust the data they are looking at, or is it being circumvented or substituted with alternate sources of similar information?
- Usability – How easily can value be extracted from the data to perform some business function?
- Objectivity – How impartial is the source of the data in the eyes of users?
- Interpretability – How understandable is the data? Is there sufficient documentation to support the raw data?
Note that people may use the word “quality” to represent the value of data, but that is a deep topic to be covered separately in the next blog post.
Measuring Data Quality in Practice
Data quality measures have a variety of uses. One such use is the management of the quality of information produced by personnel.
You may find it amusing that the act of measurement alone can lead to an increase in data quality by affecting a change in how people manage and work with data.
You can also use these practices to compare 3rd party data providers who all claim to have the best data quality among all competitors.
In practice, you will probably see the most lift from this measurement exercise by applying it where you have the most data flowing. This tends to be between software systems and analytics data pipelines.
In fact, if you’ve already instrumented your business well, most of the data from 3rd party data providers and business processes should be flowing into a data store where quality monitoring can be centralized.
Implementing Data Quality Monitoring
While running a survey to measure the subjective data quality is relatively straightforward, the objective metrics can be a challenge to implement.
Of the 9 objective data quality metrics, I would argue that only the Completeness, Integrity, Precision, and Accessibility metrics can potentially be thoroughly automated.
You can monitor these metrics by applying data tests written in SQL, another programming language, or special-purpose software.
One way to monitor data quality using SQL is to build BI dashboards tracking “data quality views” which run queries for bad data, returning any rows that defy expectations.
Alternatively, these data tests can be included as a part of, or pre-requisite to, your transformation pipelines using tools like dbt-expectations for dbt or the great-expectations library in generic orchestration workflows.
Automation Tip
For automated quality checks, you should be verifying your expectations before and after every single data processing node that moves transforms your data (cost permitting).
For the other metrics, you can start by having a human in the loop to provide the ground truth and use random sampling to benefit from the efficiency afforded by statistical tests. In some cases, you may be able to leverage automation not only to measure but fix some of these data issues.
Below, I break down sample strategies you may use to assess the data quality metric on a field-by-field basis. To develop an overall “health score” for a particular dataset, you can apply further aggregation if necessary.
Accuracy
Field Accuracy = [# records with accurate field info] / [# of records with a value in the field]
In order to get the accuracy for each field, you need some “golden records” you consider to be the ground truth. You can obtain this ground truth by manually annotating a set of entities or using an alternate highly accurate data source as a proxy.
Coverage
Field Coverage = [# real-world entities in the dataset] / [# real-world entities]
You may be able to get an automated measurement of coverage if your “universe” of entities is predefined or easily estimated.
If that’s not the case, you may use the number “missed” events as a proxy for coverage. This can be captured in your business processes as you realized some entities were missed.
Field Miss Rate = [# missed real-world entities touching system] / [# real-world entities touching system]Duplication
Duplication Rate = [# duplicates detected] / [# total records in the dataset]
This deceptively simple metric is extremely tricky to measure because duplicate records are difficult to detect.
You may use humans annotators and clever sampling strategies (which I’ve written about) to approximate your dataset’s overall duplicate rate, but this is difficult to scale.
Given your ultimate goal is to eliminate duplicates, you’re better off using an external software vendor. This is mostly a solved problem for person and company entities, and generic de-duplication strategies are available for less common duplication issues.
In the rare case that record matching vendors don’t meet your needs, you’ll have to bake a record deduplication process from scratch (let me know if this is a topic you’d like me to cover on the blog).
The best thing you can do is to put the appropriate validation in place to prevent duplicates from entering your system in the first place because it tends to be much easier to prevent data entry problems than it is to fix them.
Warning
Approach deduplication with caution because sometimes duplicate records are repeating events or separate entities in the real world. Deduplication should ideally never be a destructive operation, and an audit log of the match and action should be maintained.
Timeliness
Timeliness = [# records in the dataset that accurately represent the current real-world value] / [# total records]
As I previously explained, the difference in clock-time between a real-world event and its appearance in the dataset is difficult to measure. Moreover, it is not as important as the probability that the values are in sync when the data are observed.
To measure timeliness, you may take a small sample of “golden records” for which you have the current value (or have just annotated) and calculate the ratio between matching values and the total number of records.
Accessibility
The accessibility metric is highly context-dependent. You may find it sufficient to measure the number of users accessing the data over some period.
Alternatively, you may be interested in the number of systems the data are available in and compare that to the number of systems where the data is relevant or applicable.
In the metrics above, it was not uncommon to suggest we introduce a “human in the loop” to provide a reliable annotation of target values. To implement this in practice, you can use low-code and no-code platforms like retool or bubble to spin up an annotation process in a matter of hours.
The metrics derived from a sampling process only give you the mean of the distribution of potential values that could have produced that result. You may be interested in quantifying the uncertainty introduced by the sampling process.
You can achieve this by getting calculating a 90% confidence interval for the observed values by parameterizing a Beta distribution as follows:
Metric ~ Beta(⍺ = Numerator + 1, β = Denominator – Numerator + 1)
An easy way to think about this is in terms. of “hits” and “misses.”
Metric ~ Beta(⍺ = Hits + 1, β = Misses + 1)
To get the 90% confidence interval bounds for the metric using Excel or Google Sheets, you can use the BETA.INV(probability, ⍺, β) function.
For example, if you detected 1 duplicate out of a random sample of 50, you would calculate the bounds like so:
Duplication Rate = [# duplicates detected] / [# total records in the dataset]

5% Lower Bound => BETA.INV(0.05, 1+1, 49+1) = 0.7%
95% Upper Bound => BETA.INV(0.95, 1+1, 49+1) = 8.9%
This means there’s a 90% chance we could have gotten the results we did from an overall duplication rate of 0.7% to 8.9%!
Knowing the uncertainty associated with your metrics is certainly useful in determining if your data quality is actually changing or if it’s just an artifact of fluctuations associated with a random process.
Conclusion
We explored the core dimensions of data quality and how to measure them so we can reduce waste generated by paths pursued as a result of unreliable information.
The goal of tracking these data quality metrics is not to get a perfect measurement but rather to identify whether we’re heading in the right direction and, above all, act on that information to improve our processes.
Before you try to measure data quality across every system in your business, I’d like to remind you that not all data have the same worth, and measurement is not free.
You should identify the 20% of your data driving 80% of the value in your decisions and business processes. You can then prioritize your data quality measurement and improvement efforts on the high-value subset of data before applying these techniques more broadly.
But how exactly can you evaluate and measure the value of data, and how can we use that knowledge to inform our data strategy?

One Response
I do agree that data quality monitoring services’ aim is not to get the exact numbers, but to get a result that will gauge whether your business is heading towards your goals. If I do have a business that deals with a lot of data, of course, I would only understand why this integration in technological innovation services is important. Not only that you ensure proper operations, but you are also at peace with quality data interpretation.